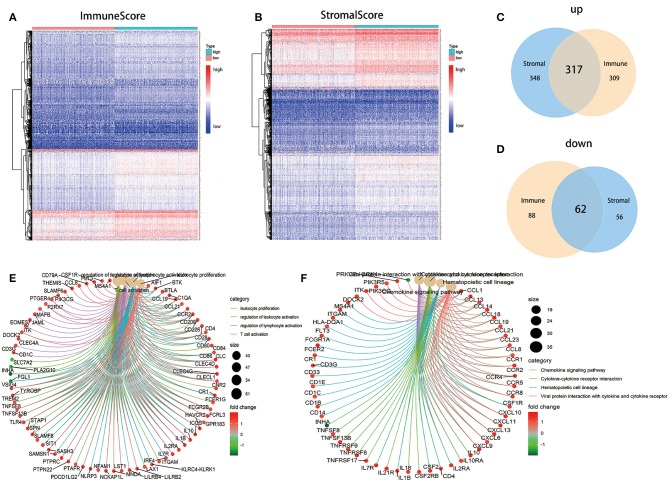
Figure 4.
Heatmaps, Venn plots, and enrichment analysis of GO and KEGG for DEGs. (A) Heatmap for DEGs generated by comparison of the high score group vs. the low score group in ImmuneScore. Row name of heatmap is the gene name, and column name is the ID of samples which not shown in plot. Differentially expressed genes were determined by Wilcoxon rank sum test with q = 0.05 and fold-change >1 after log2 transformation as the significance threshold. (B) Heatmap for DEGs in StromalScore, similar with (A). (C,D) Venn plots showing common up-regulated and down-regulated DEGs shared by ImmuneScore and StromalScore, and q < 0.05 and fold-change >1 after log2 transformation as the DEGs significance filtering threshold. (E,F) GO and KEGG enrichment analysis for 379 DEGs, terms with p and q < 0.05 were believed to be enriched significantly.

