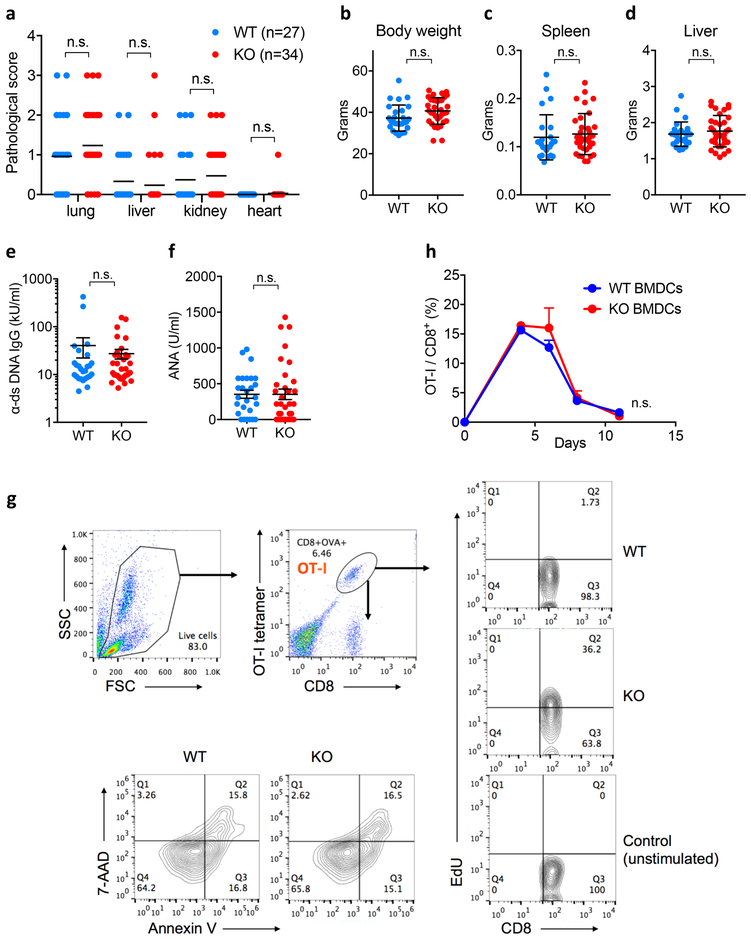
Extended Data Figure 5. Normal phenotype of Siglec-15 deficient mice.
(a) Tissue histological analysis was performed on 18-month-old Siglec-15 KO mice and WT littermate and is shown as the pathological score (see Materials and Methods). The indicated tissues were fixed in formalin, embedded with paraffin, and stained with hematoxylin and eosin. The inflammatory status of tissues was evaluated based on a semi-quantitative method that describes the level of immune infiltration. Data are presented as mean.
(b-d) The body (b), spleen (c) and liver (d) weight of Siglec-15 KO and WT mice. Data are presented as mean ± s.d.
(e, f) The levels of anti-dsDNA IgG antibodies (e) and anti-nuclear antibodies (ANA) (f) in sera of 18-month-old Siglec-15 KO and WT mice were quantified by specific sandwich ELISA. Data are presented as mean ± s.e.m. In a-f, data are analyzed by two-tailed unpaired t-test (WT n = 27 mice; KO n = 34 mice; n.s., not significant).
(g) Gating strategy for OT-I T-cell EdU incorporation and apoptosis analysis by flow cytometry.
(h) Siglec-15 KO or WT BMDCs pulsed with OVA257-264 peptide were injected i.p. into WT mice at 5×10⁵/mouse followed by i.p. injection of OT-I T-cells at 2×10⁶/mouse 6 hrs later. The OT-I in the blood at the indicated time-points were analyzed by flow cytometry. The results are shown as the percentage of OT-I among total CD8+ T-cells. Data are mean ± s.e.m. (n= 5 mice per group). Data are analyzed by two-way ANOVA.

