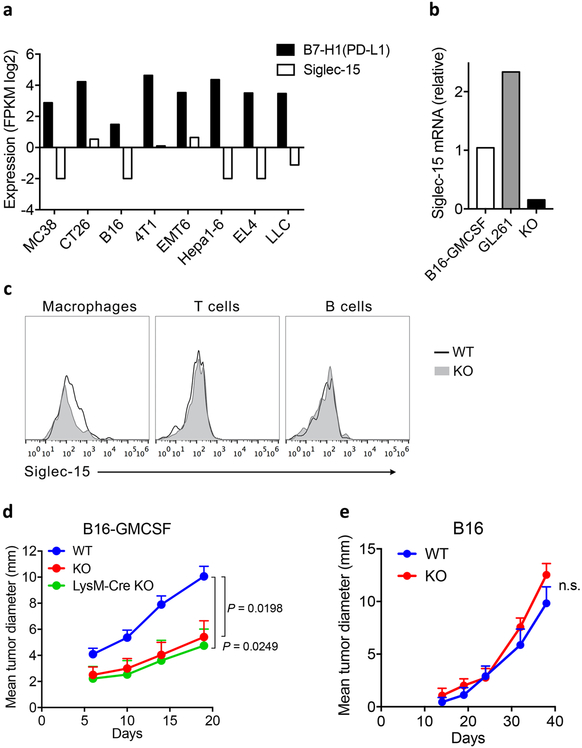
Extended Data Figure 7. Expression and function of Siglec-15 in mouse tumors.
(a) Siglec-15 mRNA expression in tumors from indicated mouse models by comparison to B7-H1, analyzed from the CrownBio MuBase database.
(b) Siglec-15 mRNA levels in tumors of B16-GMCSF and GL261 model was determined by RT-PCR on day14 after inoculation. Spleen from a S15KO mouse was used as negative control. Data are relative levels to reference gene RPL13a.
(c) Flow cytometric analysis of Siglec-15 expression on infiltrating immune cell subsets of B16-GMCSF tumors from Siglec-15 WT and KO mice on day 14 after inoculation. Data are representative of two independent experiments.
(d, e) B16-GMCSF tumor cells at 1.5×10⁶/mouse or wild type B16 tumor cells at 1×10⁶/mouse were injected s.c. into Siglec-15 WT, KO or LysM-Cre KO as indicated. Tumor growth was measured regularly and is shown as the mean tumor diameter ± s.e.m. (n=6 mice per group). P values by two-way ANOVA (n.s., not significant; P = 0.3180).

