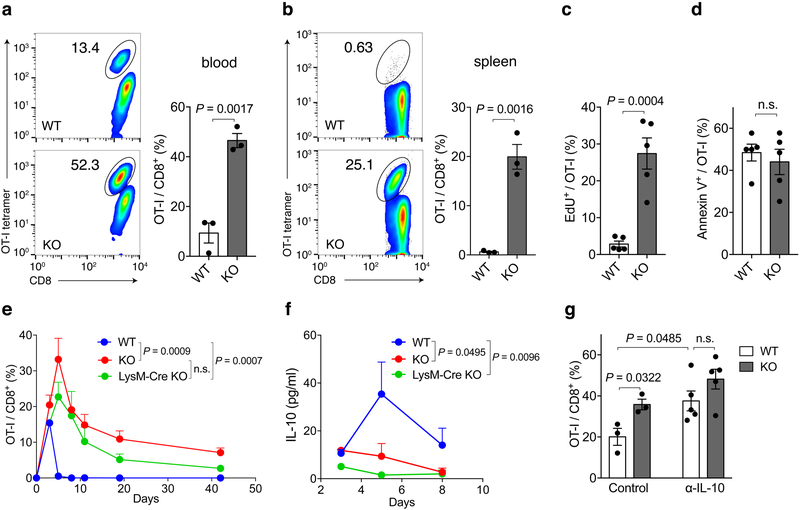
Figure 3. Inhibitory effect of Siglec-15 on antigen-specific T-cell responses in vivo.
Splenic cells from OT-I/Rag-1 KO mice were injected i.v. into WT, Siglec-15 KO or LysM-Cre KO mice on day −1. On day 0, mice were immunized i.p. with 100 μg OVA257-264 peptide plus 100μg poly(I:C). OT-I T-cells in blood on day 4 (a) and in spleen on day 5 (b) were analyzed by flow cytometry with H-2KbOVA257-264 tetramer (OT-I tetramer) and CD8 mAb staining. Representative flow cytometry analysis and quantification of OT-I T-cells among total CD8+ T-cells are shown. Data are mean ± s.e.m. (n = 3 mice per group) and representative of three independent experiments. P values by two-tailed unpaired t-test. In some experiments, WT and KO were fed with EdU at 0.8mg/ml in drinking water from day 0 of immunization. On day 5, the % of EdU+ OT-I T-cells (c) and Annexin V+ OT-I T-cells in the spleen (d) were analyzed by flow cytometry. Data are mean ± s.e.m. (n = 5 mice per group) and representative of two independent experiments. P values by two-tailed unpaired t-test (n.s., not significant; P = 0.5566). (e, f) The kinetics of OT-I T-cells in the blood (e) and IL-10 levels in the plasma (f) of WT, Siglec-15 KO and LysM-Cre KO mice after OVA257-264/poly(I:C) immunization are shown. Data are mean ± s.e.m. (WT n = 4 mice; KO or LysM-Cre KO n=3 mice) and representative of three independent experiments. P values by two-way ANOVA (n.s.; P = 0.1475). (g) WT and KO mice were treated with 200 μg anti-IL-10 mAb or isotype control mAb daily after OT-I T-cell transfer. The % of OT-I T-cells among total CD8 T-cells in blood at day 5 is shown. Data are mean ± s.e.m. (control, n = 3 mice per group; α-IL-10, n = 5 mice per group). P values by two-tailed unpaired t-test (n.s., not significant, P = 0.1581).
See also Extended Data Fig. 5.

