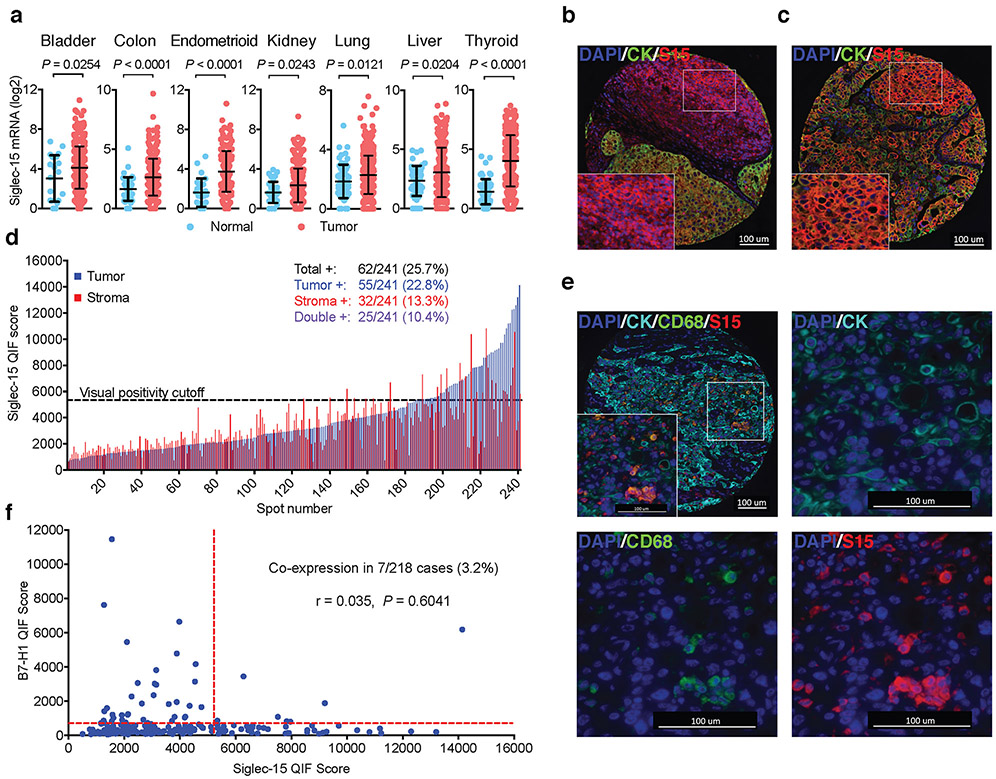
Figure 4. Siglec-15 is abundant in human cancers.
(a) The mRNA expression levels of Siglec-15 in human cancers versus corresponding normal tissues by meta-analysis of the TCGA database. Data are mean ± s.d. (bladder, n = 407 vs 20; colon, n = 288 vs 41; endometrioid, n = 175 vs 24; kidney, n = 291 vs 32; lung, n = 510 vs 58; liver, n = 373 vs 50; thyroid, n= 513 vs 59 samples of human tumor vs normal tissues). P values by two-tailed unpaired t-test.
(b-f) Siglec-15 expression on an NSCLC patient cohort by Quantitative Immunofluorescence (QIF). Representative images of formalin-fixed paraffin-embedded tissue sections with positive Siglec-15 staining on stroma (b) and tumor (c) cells using anti-Siglec-15(S15) antibody PA5-48221 (4’,6-diamidino-2-phenylindole (DAPI) [blue], cytokeratin (CK) [green], and S15 [red]). Data are representative of three independent experiments. QIF score distribution of Siglec-15 expression in tumor and stroma compartments in the NSCLC cohort (d). Numbers and percentage of patient cases with visually positive Siglec-15 on total, tumor, stromal, or both cell types are shown. Representative images of an NSCLC tumor case with Siglec-15 and CD68 co-expression (DAPI [blue], CK [cyan], CD68 [green], and S15 [red]) (e). Top left: overlay of all multiplexed markers (10X magnification); top right: CK and DAPI (40X); bottom left: CD68 and DAPI (40X); bottom right: S15 and DAPI (40X). Data are representative of three independent experiments. The correlation between B7-H1 and Siglec-15 expression was assessed on serial tumor sections of the same cohort (f). Pearson r score and P value are shown.
See also Extended Data Fig. 6.

