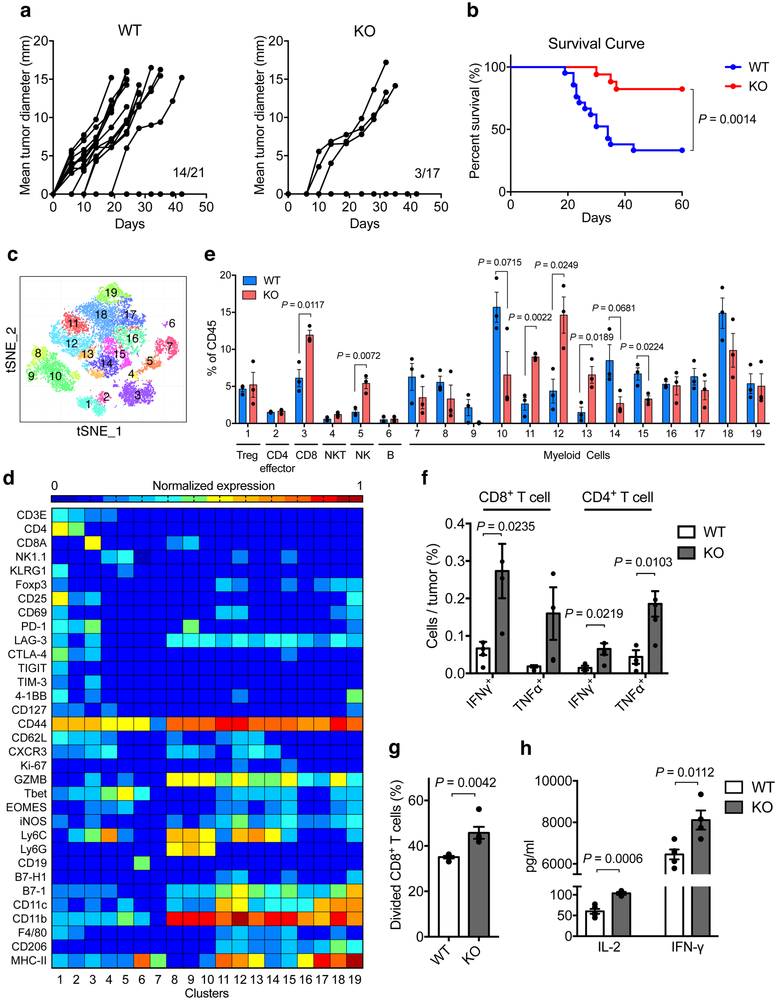
Figure 5. Effect of Siglec-15 on tumor growth in syngeneic mice.
(a, b) B16-GMCSF tumor cells at 1.5×10⁶ were injected s.c. into Siglec-15 WT and KO mice. Tumor incidence and growth in individual mouse (a) and percentage of survival (b) are shown. (WT, n = 21 mice; KO, n =17 mice; results were pooled from two independent experiments). P values by two-sided Log-rank test.
(c-e) Mass cytometry analysis of tumor-infiltrating leukocytes at day 14 after B16-GMCSF tumor inoculation. t-SNE plot of tumor infiltrating leukocytes overlaid with color-coded clusters (c). Heatmap displaying normalized marker expression of each immune cluster (d). Frequency of clusters of indicated immune cell subsets (e). Data are mean ± s.e.m. (n = 3 mice per group). P values by two-tailed unpaired t-test.
(f-h) The ex vivo function analysis of B16-GMCSF tumor-infiltrating T-cells or myeloid cells. T-cells (f) or myeloid cells (g, h) were isolated from B16-GMCSF tumors from WT and KO mice at day 14. The % of IFN-γ and TNF-α producing T-cells were analyzed by intracellular staining after 4 hrs re-stimulation with PMA and ionomycin (f). CD11b+ myeloid cells were co-cultured with CSFE-labeled naïve splenic CD8+ T-cells stimulated with anti-CD3. T-cell proliferation (g) and cytokine production (h) was analyzed at 48 hrs. Data are mean ± s.e.m. (n = 4 mice per group) and representative of two independent experiments. P values by two-tailed unpaired t-test.
See also Extended Data Figs. 7-9.

