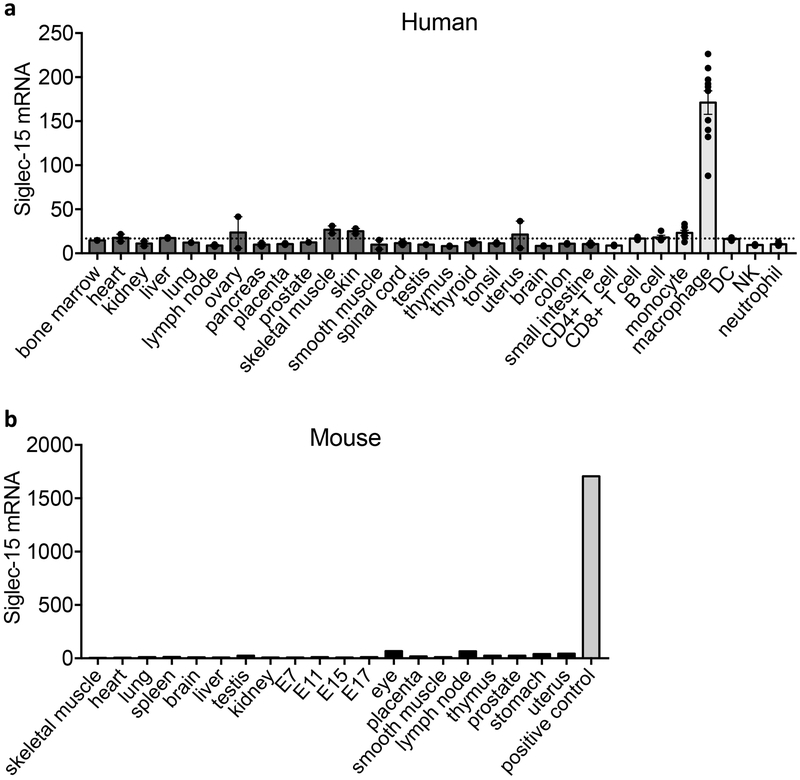
Extended Data Figure 2. Siglec-15 mRNA expression in normal tissues of human and mouse origin.
(a) Siglec-15 mRNA relative levels in human tissues and immune cell subsets from BioGPS database. A dash line was added to indicate the flow cytometry detection threshold (verified by Siglec-15 negative staining on CD8 T cells). Data are mean ± s.e.m. (tissues, n = 2; monocyte, n = 6; macrophage, n = 10; other immune subsets, n = 4 samples).
(b) Siglec-15 mRNA expression in mouse tissues was tested by RT-PCR, quantified by ImageJ software (NIH) and normalized to the levels of reference gene GAPDH. The 293T-cells overexpressing Siglec-15 were used as a positive control. E7, day 7 embryos.

