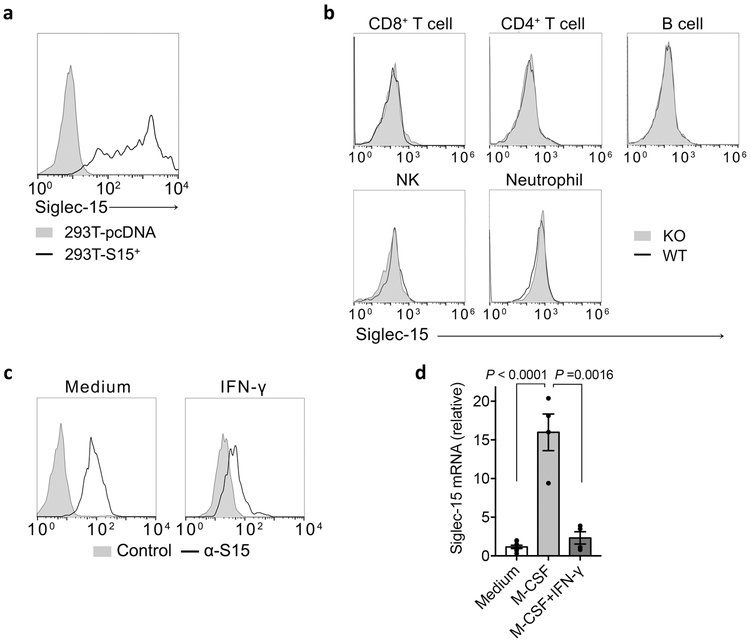
Extended Data Figure 3: Siglec-15 protein expression on human and mouse immune cells.
(a) Flow cytometry analysis of 293T-cells transfected with empty vector (pcDNA) or plasmid with full length Siglec-15 gene and stained by m03 (anti-Siglec-15 mAb).
(b) Siglec-15 expression on lymphocytes and neutrophils from S15KO and WT mice by flow cytometry analysis with m03. In a and b, data are representative of three independent experiments.
(c) Flow cytometry analysis of Siglec-15 expression on the RAW264.7 macrophage line treated with or without 20 ng/ml recombinant murine IFN-γ for 48 hrs.
(d) Human CD14+ monocytes from peripheral blood were incubated for 7 days in the presence of 100 ng/ml M-CSF (M-CSF group) or M-CSF for 4 days followed by M-CSF plus 50 ng/ml IFN-γ for 3 more days (M-CSF + IFN-γ group) or medium only as control (Medium). Siglec-15 mRNA levels was determined by RT-PCR. Data are presented as mean ± s.e.m. after intra-sample normalization to the reference gene GAPDH (n = 4 cell cultures). P values by two-tailed unpaired t-test. In c and d, data are representative of two independent experiments.

