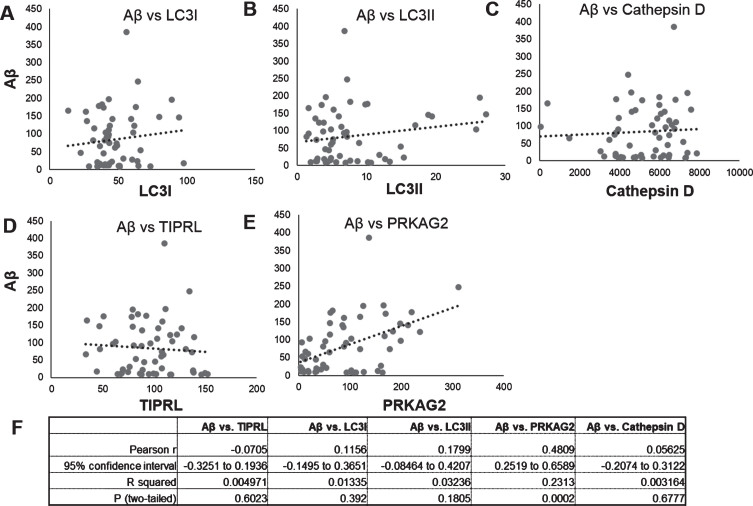
Fig.3.
Correlation of Aβ and autophagy proteins LC3, Cathepsin D, PRKAG2, and TIPRL mRNA and protein levels. Correlation of Aβ protein levels (Fig. 2) to protein levels of LC3B isoforms, LC3I (Fig. 2C), LC3II (Fig. 2D), mature Cathepsin D (Fig. 2E), PRKAG2 (Fig. 3C), and TIPRL (Fig. 3D) was done using Pearsons correlation analysis. Aβ levels positively correlated to PRKAG2 levels (r = 0.4809, p < 0005).

