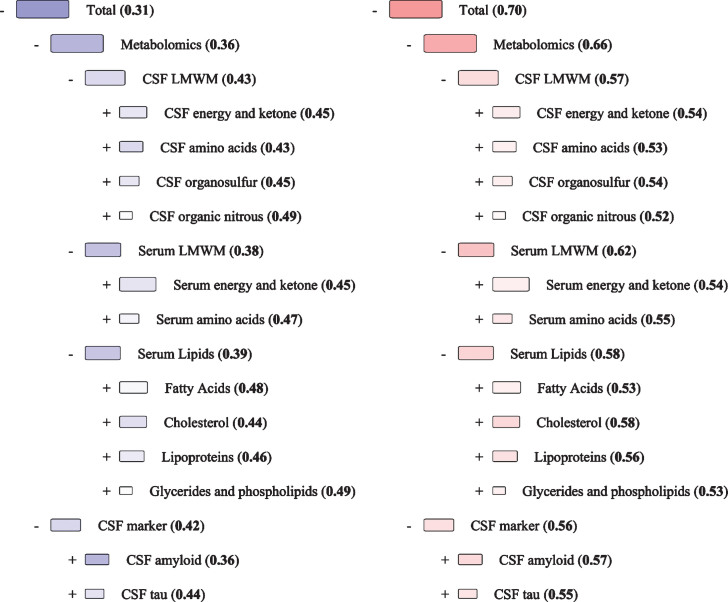
Fig.1.
Disease State Fingerprint for MCI with amyloid pathology versus Dementia with amyloid pathology. These figures illustrate a hypothetical case where all measurement values are equal to the median value for the diagnostic group. The numbers are the Disease State Index values for each comparison and range between 0 and 1 and are also reflected in the color scale of the nodes from blue to red. Blue color indicates more similarity MCI, while red indicates a higher similarity to Dementia, and white is equally typical for both diagnoses. The size of a node corresponds to the relevance (Youden index), which is the ability to distinguish the two diagnoses from each other. CSF, cerebrospinal fluid; LMWM, low-molecular-weight metabolites; MCI, mild cognitive impairment.

