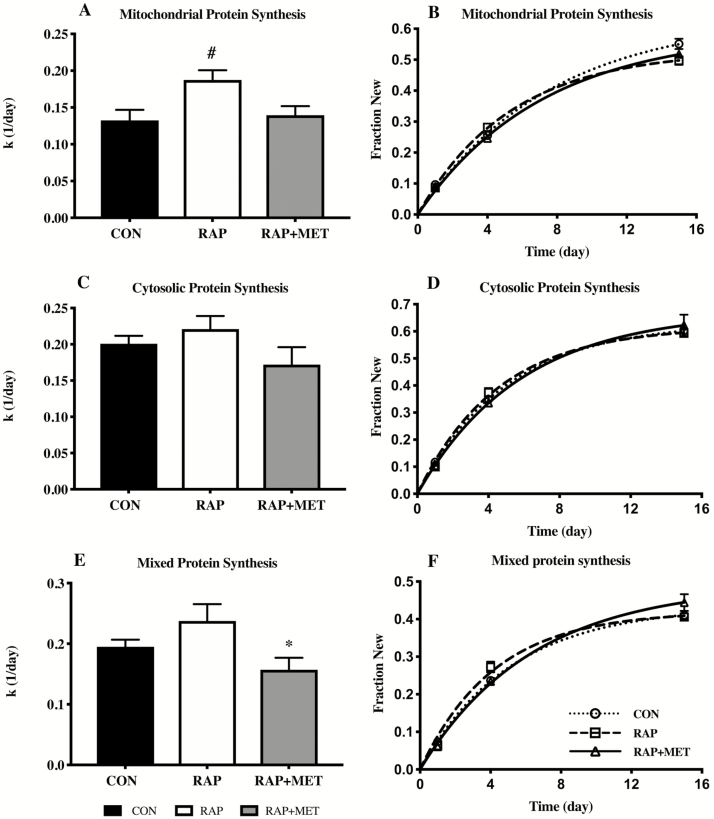
Figure 2.
Protein synthesis rates (k) and nonlinear regression plots of mitochondrial (A and B), cytosolic (C and D), and mixed (E and F) protein fraction new in older female mice. *Significantly different from RAP+MET. #Significantly different from CON and RAP+MET. n = 9 per group. All values expressed as mean ± SEM.

