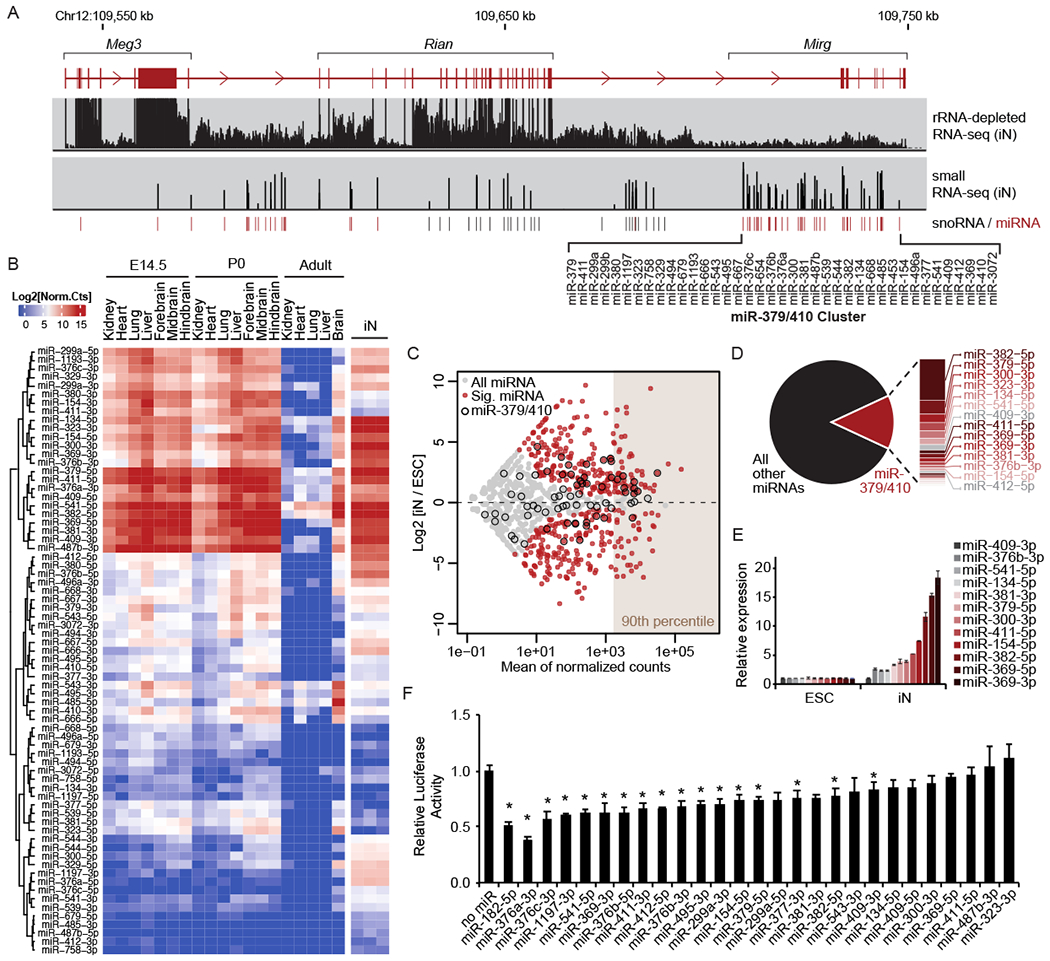
Figure 1. miR-379/410 expression is induced upon neuron differentiation.

A. Schematic of the annotated Meg3 long non-coding RNA and small non-coding RNAs processed from the locus (snoRNA, small nucleolar RNA; miRNA). The location of the miR-379/410 cluster is indicated, along with genomic alignment of rRNA-depleted RNA-seq and small RNA-seq data from iNs. B. Heatmap of normalized counts of mature miRNAs from the miR-379/410 cluster generated by small RNA-seq of mouse tissues at embryonic day 14.5 (E14.5), postnatal day 0 (P0), adult tissues, and in vitro differentiated iNs (n = 3). Rows are organized by unsupervised hierarchical clustering. C. Expression changes of miRNAs upon neuron differentiation shown as an MA plot. Gray, all miRNAs; Red, differentially expressed miRNAs (p ≤ 0.05, fold change ≥ 2); Black outline, miR-379/410. miRNAs in the 90th percentile of expression are indicated. D. Pie chart indicating the proportion of small RNA-seq reads mapping to miR-379/410 miRNAs versus all other miRNAs in iNs. E. qRT-PCR for mature miRNAs from miR-379/410 in iNs relative to ESCs. Mean ± SEM (n = 3). F. Bar graph of Firefly luciferase activity with or without 3’ UTR miRNA target sites relative to Renilla luciferase internal control. Mean ± SEM (n = 6); *p ≤ 0.05, calculated using unpaired two-tailed Student’s t-test. See also Figure S1.
