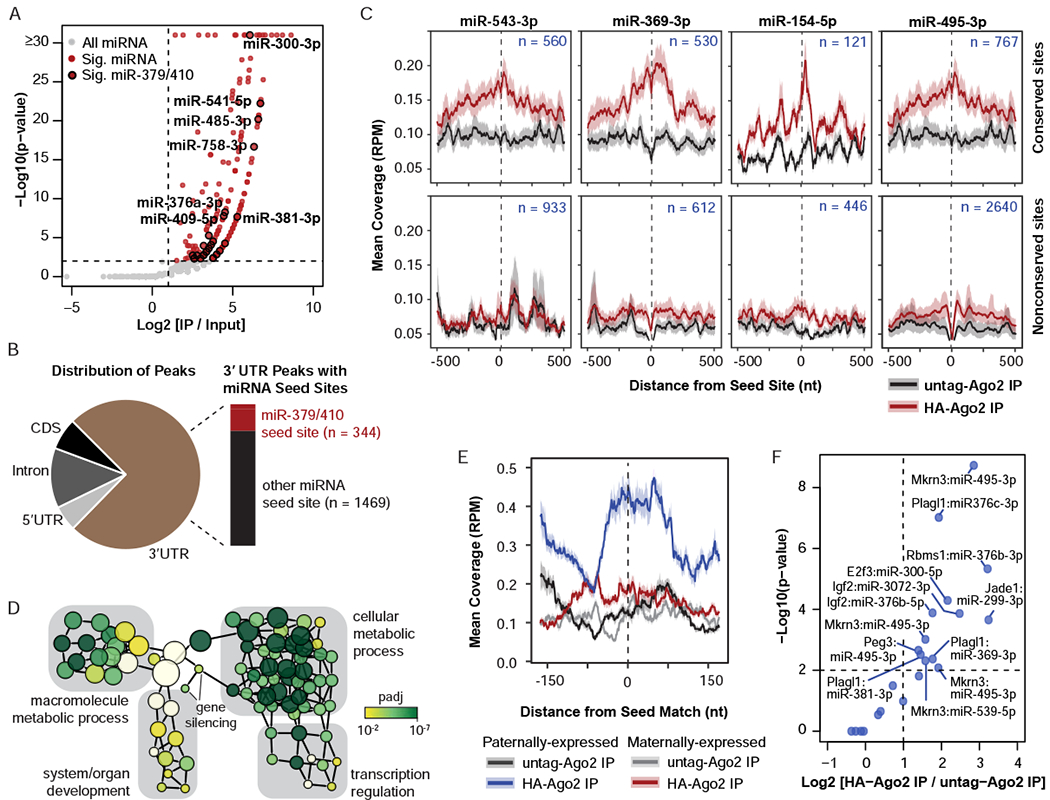
Figure 2. miR-379/410 directs Ago2 to transcriptional and developmental regulators, including paternally-expressed transcripts.

A. Volcano plot of seCLIP-seq reads mapped to miRNAs. Gray, all miRNAs (n = 2,045); Red, significantly enriched miRNAs (p ≤ 0.01, fold change ≥ 2, n = 211); Black outline, significantly enriched miR-379/410 (p ≤ 0.01, fold change ≥ 2, n = 27). The identities of the most highly enriched miR-379/410 miRNAs are labelled. B. Left: Pie chart indicating distribution of significant Ago2 peaks in 5’ UTR, Intron, CDS (coding sequence), and 3’ UTR. Right: Bar graph of the number of significant Ago2 peaks in 3’ UTRs that overlap with a seed site for an active miR-379/410 miRNA. C. Metagene plots of Ago2 seCLIP-seq coverage (reads per million, RPM) at seed sites for the indicated miRNAs, including coverage 500 nt upstream and downstream of the seed site. The number of sites included in each plot is shown. Top, conserved sites; Bottom, nonconserved sites with TargetScan score ≥ 90; Black, untagged-Ago2 IP; Red, HA-Ago2 IP. D. Biological network of gene ontology terms associated with miR-379/410 targets identified by Ago2 seCLIP-seq. The node size corresponds to the number of genes in the node. The node color indicates the adjusted p-value for the association of the gene ontology term with the miR-379/410 targets relative to the background of all expressed genes. E. Metagene plot of Ago2 seCLIP-seq coverage (reads per million, RPM) at conserved seed sites for active miR-379/410 in paternally-expressed transcripts (n = 33 seed sites) and maternally-expressed transcripts (n = 25 seed sites), including coverage 175 nt upstream and downstream of the seed site. F. Volcano plot of Ago2 peaks in paternally-expressed transcripts. Dashed lines, cutoffs for significant peaks (p ≤ 0.01, fold change ≥ 2). See also Figure S2 and Table S1.
