
Figure 3. miR-379/410 targets are de-repressed upon maternal miR-379/410 deletion.
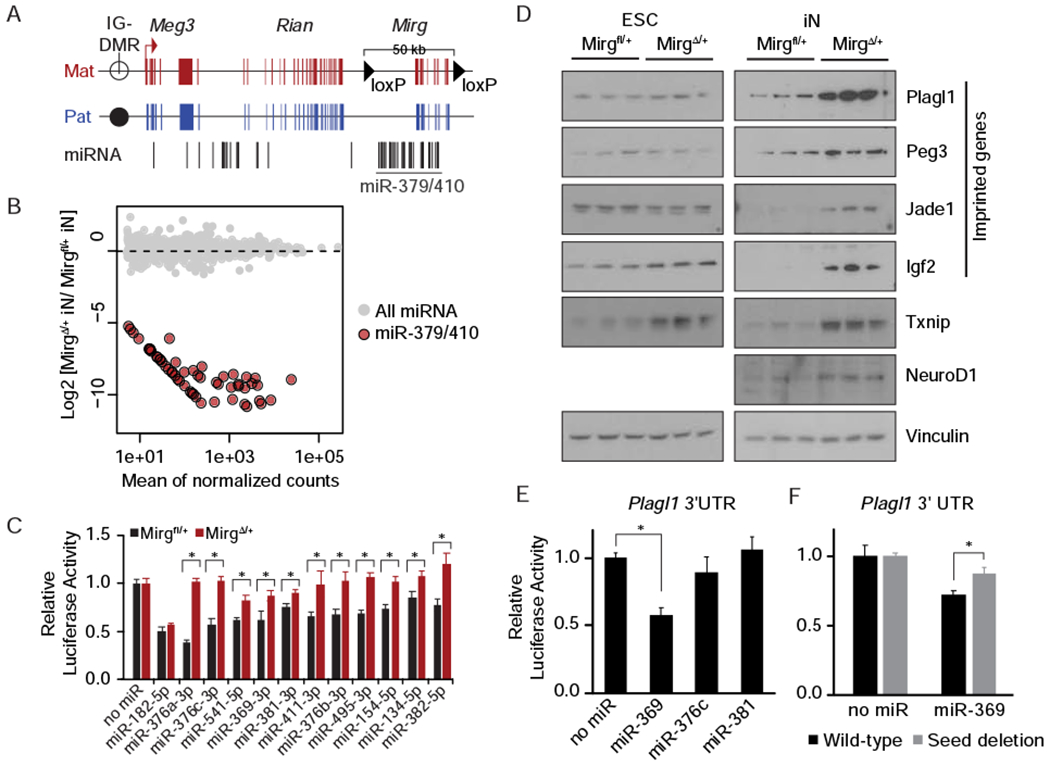
A. Schematic of the Meg3 genomic locus showing location of maternal loxP insertions flanking the miR-379/410 cluster. IG-DMR, intergenic differentially methylated region. B. Expression changes of miRNAs upon maternal deletion of miR-379/410 shown as an MA plot. Gray, all miRNAs; Red, miRNA-379/410. C. Bar graph of Firefly luciferase activity with or without 3’ UTR miRNA target sites relative to Renilla luciferase internal control. Black, Mirgfl/+ iNs; Red, MirgΔ/+ iNs; Mean ± SEM (n = 6); *p ≤ 0.05. D. Western blot of protein lysates from Mirgfl/+ and MirgΔ/+ ESCs and iNs probed with the indicated antibodies. Vinculin was used as a loading control. Biological triplicates are shown for each condition. E. Bar graph of relative luciferase activity upon overexpression of the indicated miRNAs in Mirgfl/+ iNs from a luciferase reporter containing Plagll 3’ UTR sequence. Mean ± SEM (n = 6); *p ≤ 0.05. F. Same as (E) but with a wild-type or deleted miR-369 seed site in the Plagl1 3’ UTR luciferase reporter. Mean ± SEM (n = 6); *p ≤ 0.05. P-values were calculated using unpaired two-tailed Student’s t-test. See also Figure S3 and Figure S4.