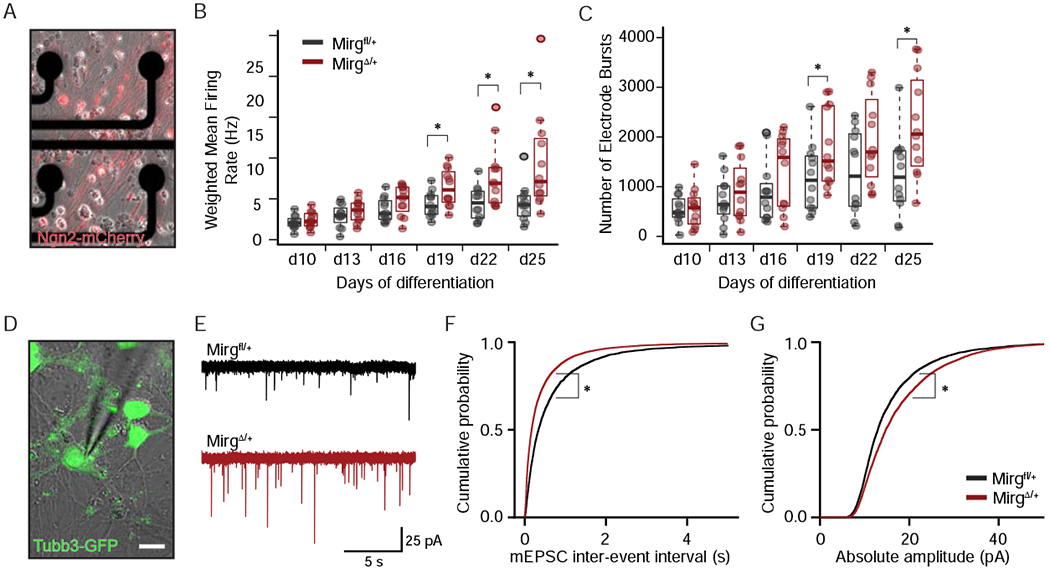
Figure 5. Increased frequency and amplitude of synaptic events upon maternal miR-379/410 deletion.

A. Overlay of brightfield and Ngn2-mCherry fluorescence image of iNs growing on multielectrode array (MEA) plate. B. Boxplot of weighted mean firing rate and C. electrode bursts from MEA recordings at day 10 to 25 of differentiation. Individual data points are the mean of 16 electrodes in a single well. Black, Mirgfl/+ iNs (n = 12 wells); Red, MirgΔ/+ iNs (n = 12 wells); *p ≤ 0.05, calculated using unpaired two-tailed Student’s t-test. D. Overlay of differential interference contrast (DIC) image and Tubb3-GFP fluorescence for one example recorded iN. Scale bar, 10 μm. E. Example voltage-clamp recordings of miniature excitatory post-synaptic events (mEPSCs) in Mirgfl/+ and MirgΔ/+ iNs. F. CDF plot of mEPSC inter-event interval (p = 10−98) and G. amplitude (p = 10−37) for n = 4,459 and 7,752 events in Mirgfl/+ and MirgΔ/+ iNs respectively. P-values were calculated using two-sided Kolmogorov-Smirnov test. See also Figure S5.
