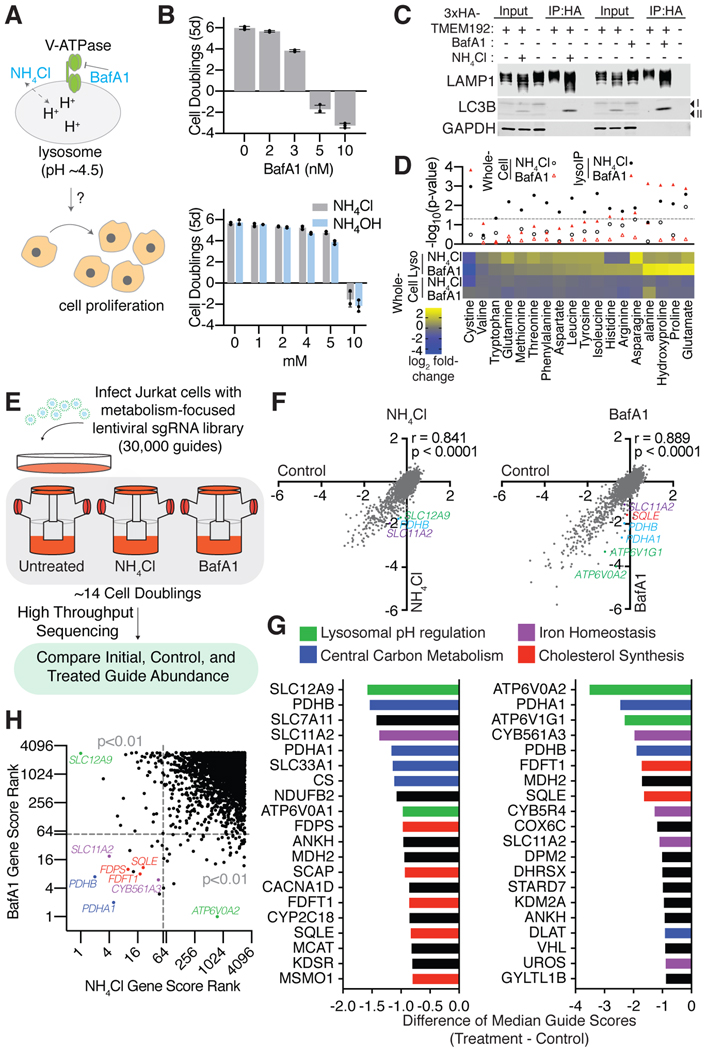
Figure 1: A metabolism-focused CRISPR-Cas9 genetic screen identifies genes whose loss sensitizes cells to lysosomal pH inhibitors.
(A) Maintaining lysosomal pH is essential for cells to proliferate. Ammonia and BafAl disrupts lysosomal pH through different mechanisms.
(B) Dose-dependent effects of BafAland ammonia on Jurkat cell proliferation (mean ± SD, n=3).
(C) Immunoblotting for lysosomal markers in input, purified lysosomes, or control immunoprecipitates in the presence or absence of BafAl (10nm) or NH4Cl (10mM). Lysates were prepared from cells expressing 3xHA-tagged TMEM192 (HA-Lyso cells) or 3xFLAG-tagged TMEM192 (FLAG control cells).
(D) Metabolite abundance in cells or lysosomes upon treatment with BafA1 (10nm) or NH4Cl (10mM). P-values are for comparisons between metabolite concentrations in whole-cell or lysosome samples (upper panel) (n = 3 for each treatment; dotted line represents P = 0.05). Heat map of fold changes (log2) in metabolite concentrations of treatment relative to control (lower panel).
(E) Scheme describing the pooled CRISPR-based screen.
(F) Gene scores in untreated versus ammonia-treated (3mM) Jurkat cells (left). Gene scores in untreated versus BafA1-treated (3nM) Jurkat cells (right). The gene score is the median log2 fold change in the abundance of all sgRNAs targeting that gene during the culture period. Most genes, as well as non-targeting control sgRNAs, have similar scores in the presence or absence of the treatments.
(G) Top 20 genes scoring as differentially required upon ammonia (left) or BafA1 (right) treatment. Genes associated with lysosomal pH regulation are indicated in green, iron homeostasis in purple, central carbon metabolism in blue and cholesterol synthesis in red.
(H) Plot of gene score ranks from ammonia and BafA1 screens. Significant (P<0.01) unique hits in the BafA1 are in the lower right quartile, significant unique hits in the ammonia screen are in the upper left quartile, and significant hits shared in both screens are in the lower left quartile.

