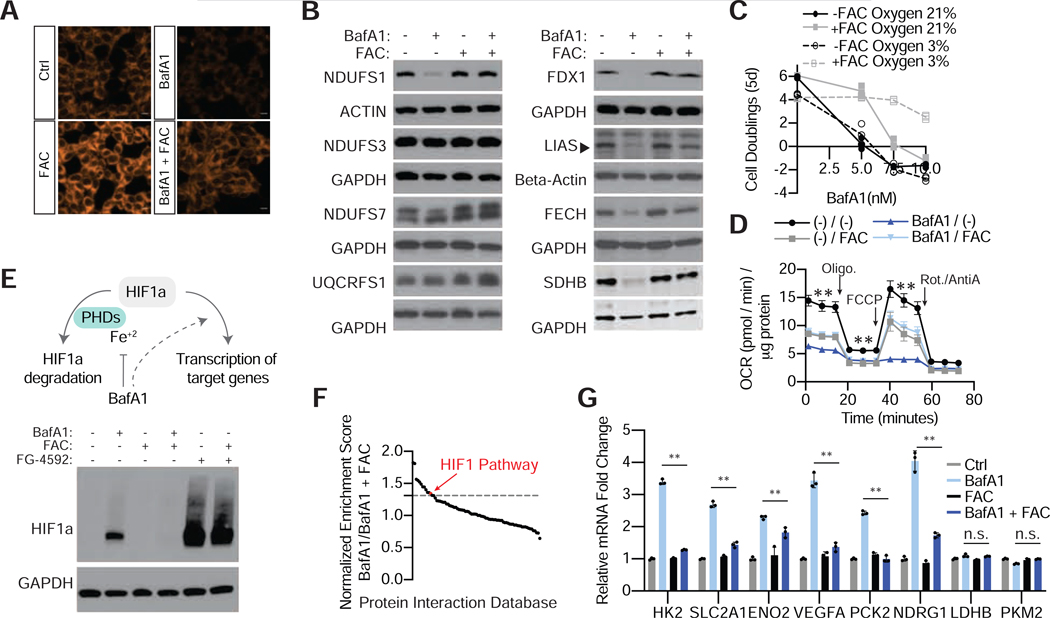
Figure 5: Cellular processes restored by iron supplementation under lysosomal dysfunction.
(A) Ferro-orange staining for intracellular Fe2+ in 293T cells cultured in the presence or absence of BafA1 (10nM) and/or FAC (0.1mg/ml). Shown is one of five representative fields illustrating fluorescence intensity taken at identical exposures for each condition. Scale bar, 10 μm.
(B) Immunoblotting for the indicated iron sulfur cluster containing proteins. GAPDH and Beta-actin are used as loading controls.
(C) High oxygen levels disrupt iron sulfur clusters. Fold change in cell number (log2) of Jurkat cells in the absence and presence of FAC (0.1mg/mL) and hypoxia after treatment with indicated concentrations of BafA1 for 5 days (mean ± SD, n=3, **p<0.05).
(D) Oxygen consumption rate in 293T cells in the presence and absence of BafA1 (10nM) with and without iron supplementation (FAC 0.1mg/ml) (mean ± SD, n=9, **p<0.05).
(E) Illustration of HIF1a stabilization by BafA1-mediated iron depletion (left). Immunoblotting for HIF1a in 293T cells grown in the presence or absence of BafA1 (10nM) and/or FAC (0.1mg/ml) (right).
(F) Gene set enrichment analysis (GSEA) on FPKM values from RNA-seq performed on 293T cells grown in the presence or absence of BafA1 (10nM) and/or FAC (0.1mg/ml). Graphed are normalized enrichment scores from 86 enriched pathways using the protein interaction database as the gene set. Values above the gray dotted line are pathways enriched with a nominal p-value <0.05. Highlighted in red is the HIF1a pathway.
(G) Relative expression of canonical HIF1a transcription targets (FPKM normalized to Control) from above RNA-seq experiment (mean ± SD, n=3, **p<0.05).

