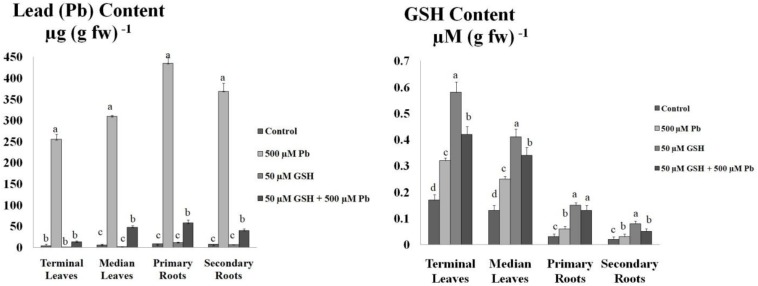
FIGURE 2.
Lead (Pb) and GSH concentration in upland cotton leaves and roots. Upland cotton seedlings exposed to Pb (500 μM) and GSH (50 μM) alone and in combination showing Pb uptake and GSH concentration in terminal leaves and median leaves, and primary roots and secondary roots. Error bars on columns show standard deviation among the values. Chart data are means of three independent biological replications, analyzed through one way analysis of variance (ANOVA) and significant difference determined by Duncan’s multiple range test at 0.05% probability level.

