FIGURE 3.

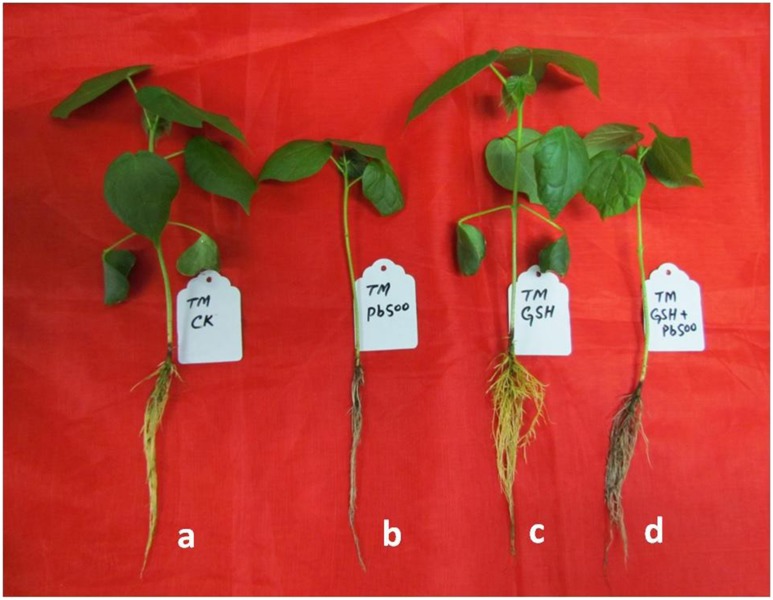
Visual impact of Pb and GSH on upland cotton seedlings. Photographs of upland cotton seedlings (variety TM-1) representing control (a), and those treated with 500 μM Pb (b), 50 μM GSH (c) and 500 μM Pb + 50 μM GSH (d).

Visual impact of Pb and GSH on upland cotton seedlings. Photographs of upland cotton seedlings (variety TM-1) representing control (a), and those treated with 500 μM Pb (b), 50 μM GSH (c) and 500 μM Pb + 50 μM GSH (d).