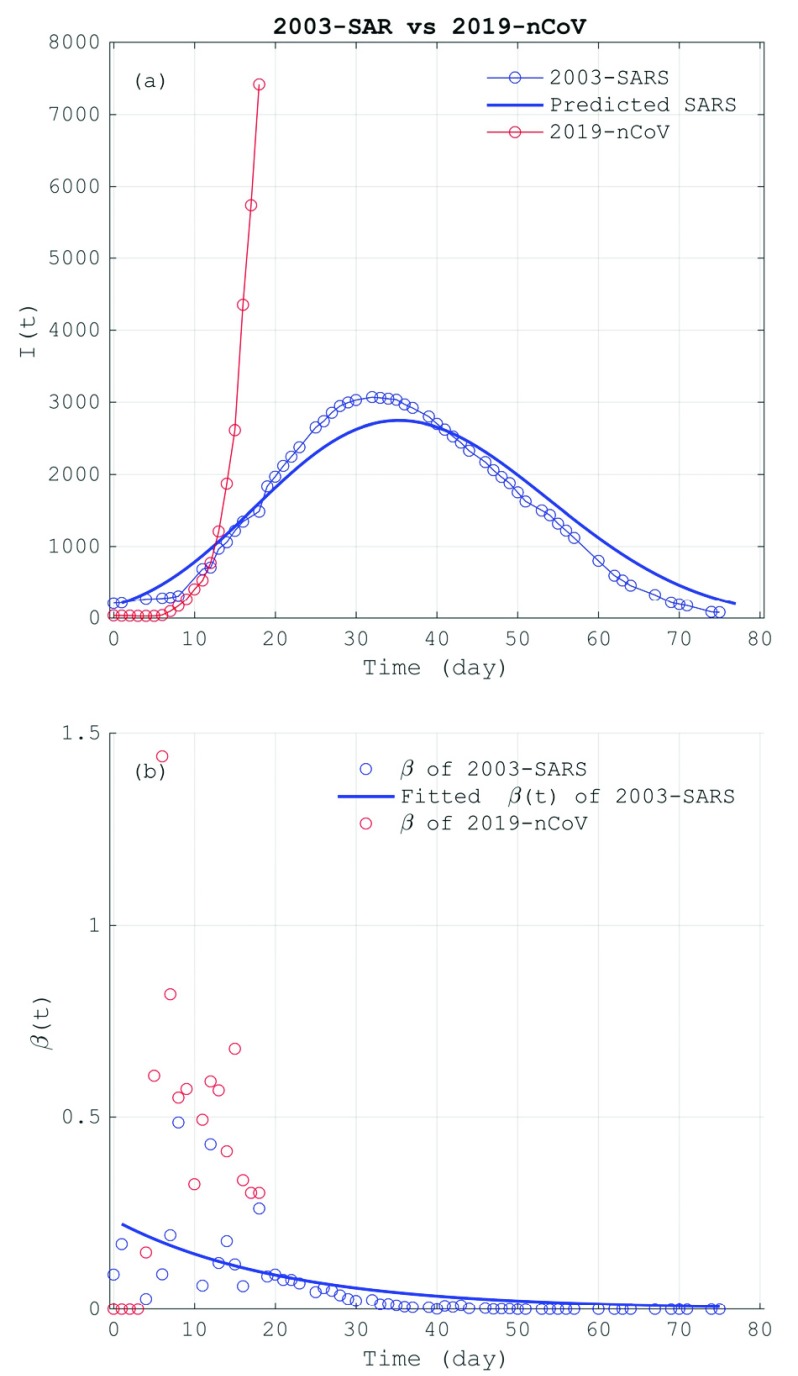
FIGURE 1.
The comparison between SARS in 2003 (2003-SARS) and 2019-nCoV: (a) the number of the infectives (I(t)) of SARS during 10 April 2003 to 24 June 2003 (blue-circle line) and the 2019-nCoV during 11 Jan 2020 to 29 Jan 2020 (red-circle line), where the thick blue line is the prediction of the model Eq. (4) for the 2003-SARS; (b) the infection rates ( (t)) of SARS (blue circles) and 2019-nCoV (red circles), and the exponentially fitted line of the infection rate of the 2003-SARS (blue line).

