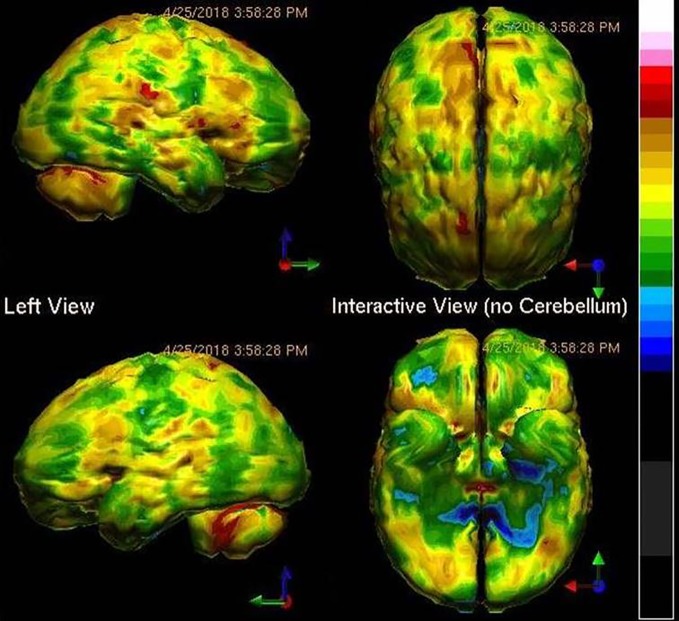
Figure 1.
Tc-99m-HMPAO perfusion SPECT scan data presented in surface rendering. The color scale is scaled relative to the patient's mean cerebral perfusion. Mean blood flow (72%) is in yellow. Color shifts occur at approximately every 0.5 SD (3%) relative to the patient's mean. Diffuse cortical hypoperfusion (green and blue) is clearly evident.

