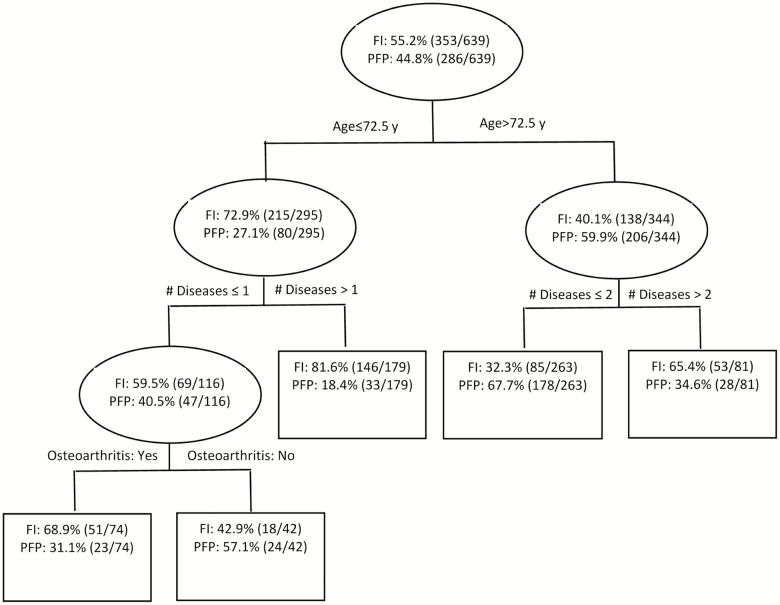
Figure 1.
Results from the Classification And Regression Tree (CART) analysis showing characteristics that best distinguish those who were deemed frail by the PFP, but not the FI, from those who were frail by the FI, but not the PFP, in the combined Cardiovascular Health Study original and African American cohorts (n = 639). PFP = physical frailty phenotype; FI = frailty index.

