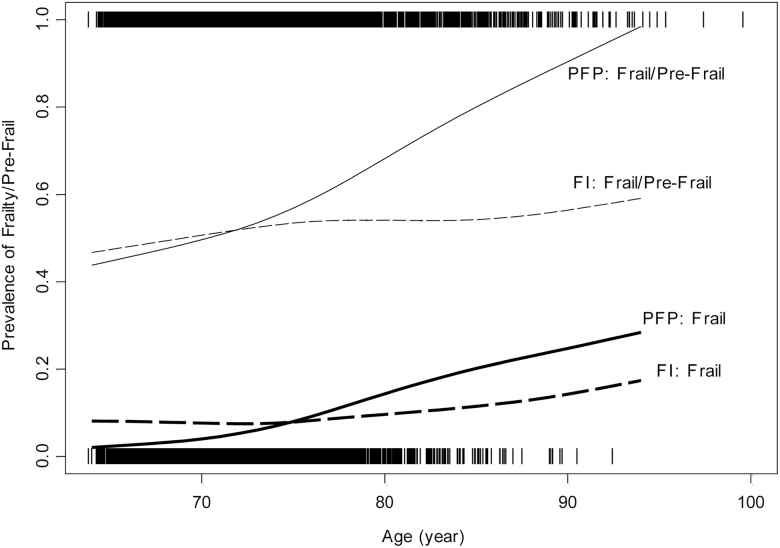
Figure 2.
Prevalence of being PFP-Frail (thick solid line), FI-Frail (thick dashed line), PFP-Frail/Pre-Frail (thin solid line), and FI-Frail/Pre-Frail (thin dashed line) by age in the combined Cardiovascular Health Study original and African American cohorts (N = 5,362). The distance between the solid lines (or between dashed lines) represents the prevalence of being PFP-Pre-Frail (or FI-Pre-Frail). PFP = physical frailty phenotype; FI = frailty index.

