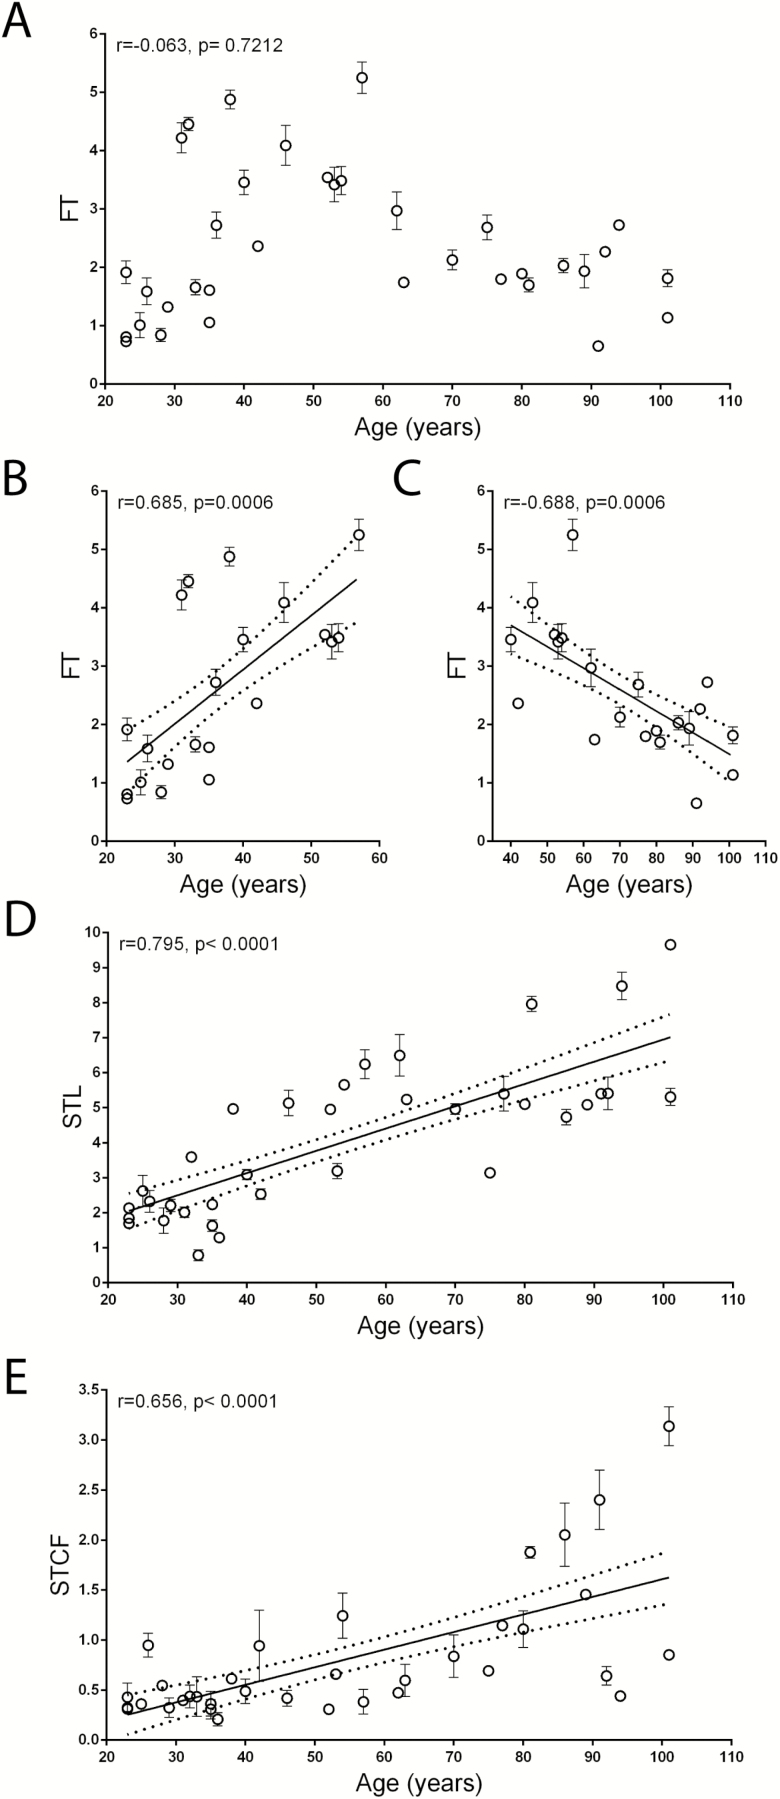
Figure 2.
Correlation between aberrant telomeric structures (%) and age in the sample population. (A) Percentage of fragile telomeres (FT) in peripheral blood mononuclear cells (PBMCs) of all subjects. (B) Percentage of FT in PBMCs of subjects belonging to the younger group. (C) Percentage of FT in PBMCs of subjects belonging to the older group. (D) Percentage of telomeres displaying sister telomere loss (STL) in PBMCs of all subjects. (E) Percentage of sister telomere chromatid fusions (STCF) in PBMCs of all subjects. Data are expressed as the mean (± SD) from two experiments. Linear regression (continuous line) and 95% confidence band (dotted lines) are shown in B–E. r = Pearson correlation coefficient; p = statistical significance of Pearson correlation coefficient.

