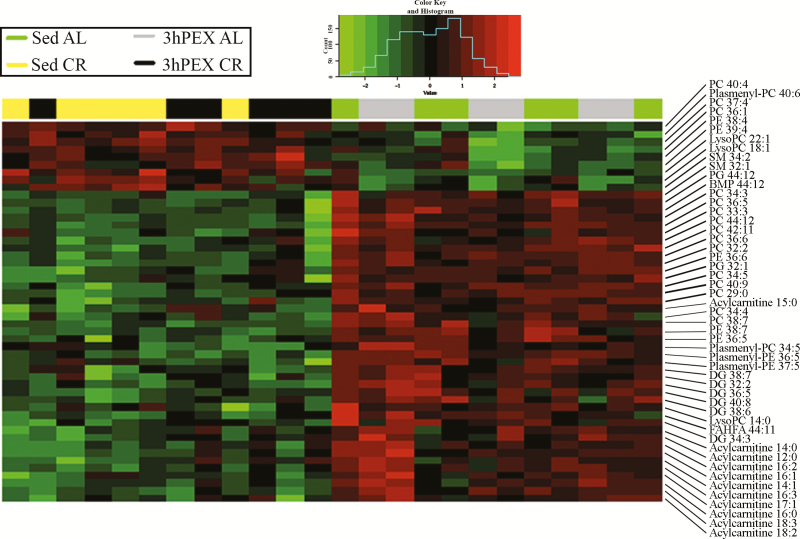
Figure 3.
Heatmap that depicts a two-dimensional hierarchical clustering of the data for the 50 lipid species in rat epitrochlearis muscle with the lowest p-values for main effects of Diet (n=6/group). Green denotes calorie restriction values lower than ad libitum, and red denotes calorie restriction values greater than ad libitum.

