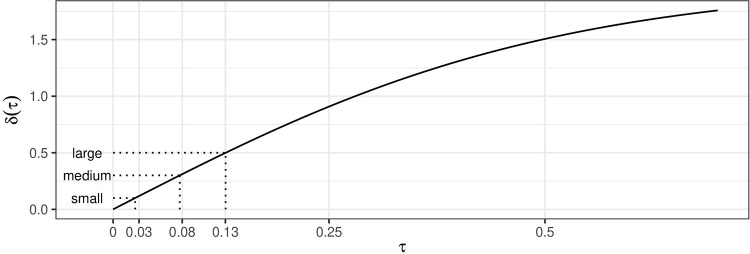
Fig 6. The difference between backtransformed quantiles δ(τ) = tanh(θk,97.5%) − tanh(θk,2.5%) as a function of between-study heterogeneity τ for θ = 0.
The values corresponding to small, medium, and large effect sizes on the correlation scale according to the classification by Cohen [31] are depicted by dotted lines.

