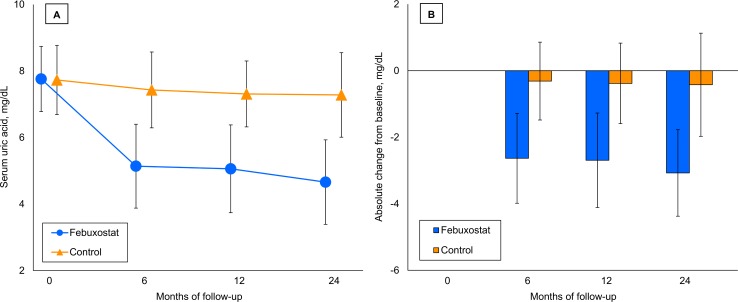
Fig 3. Changes in SUA.
The values are expressed as means, with the error bars showing the SDs. (A) Changes in mean SUA. The mean values of SUA were lower in the febuxostat group at 6 months (febuxostat, 5.14 [SD 1.26] mg/dL versus control, 7.43 [SD 1.14] mg/dL; mean between-group difference [febuxostat − control] −2.28 mg/dL [95% CI −2.50 to −2.06 mg/dL ]; P < 0.001), 12 months (febuxostat: 5.06 [SD 1.32] mg/dL versus control, 7.31 [SD 0.99] mg/dL; mean between-group difference −2.25 mg/dL [95% CI −2.47 to −2.03 mg/dL]; P < 0.001), and 24 months (febuxostat, 4.66 [SD 1.27] mg/dL versus control, 7.28 [SD 1.27] mg/dL; mean between-group difference −2.62 mg/dL [95% CI −2.86 to −2.38 mg/dL]; P < 0.001). (B) Absolute changes in SUA. The mean between-group differences in the absolute change in SUA from baseline were also significant at 6 months (−2.31 mg/dL [95% CI −2.55 to −2.08 mg/dL]; P < 0.001), 12 months (−2.31 mg/dL [95% CI −2.56 to −2.06 mg/dL]; P < 0.001), and 24 months (−2.65 mg/dL [95% CI −2.93 to −2.37 mg/dL]; P < 0.001). CI, confidence interval; SD, standard deviation; SUA, serum uric acid.

