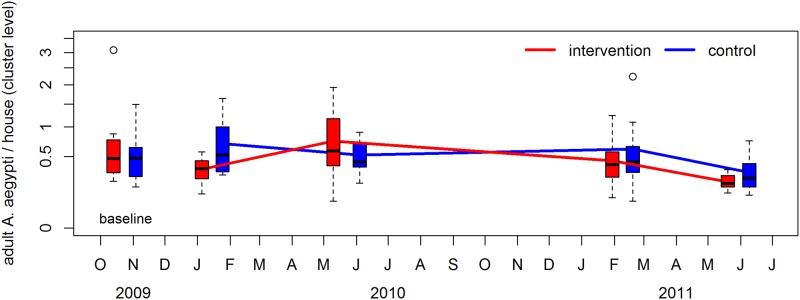
Fig 3. The average number of female Ae. aegypti collected per house. Intervention clusters are shown in red and control clusters are shown in blue.
The upper and lower limits of each box are the interquartile range across clusters. Each ‘whisker’ (dashed line) extends to the most extreme data point which is no more than 1.5 times the interquartile range from the box. Circles represent values which are more extreme than the whiskers. The baseline data are represented by the boxes corresponding to October/November 2009.

