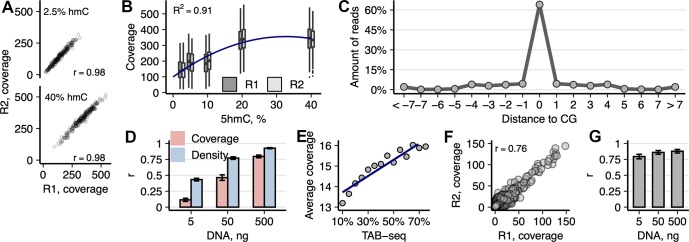
Fig 2. Analysis of hmTOP-seq libraries in model lambda genome and mESCs.
(A) Correlation between the coverage of 2.5% and 40% pre-hydroxymethylated GCGC sites in the technical replicates of hmTOP-seq libraries of lambda bacteriophage genome. (B) Dependence of hmTOP-seq coverage on the level of hydroxymethylation of GCGC sites in bacteriophage lambda DNA. Quadratic regression was used to fit the plotted data (Y = 99.5 + 15.7X − 0.240X2). (C) Distance distribution of read start positions from a nearest CG site in the hmTOP-seq library of mESC DNA (500-ng input). (D) Correlation of 5hmCG coverage and h-density signals in replicates of hmTOP-seq libraries prepared with varying amounts of mESC DNA. h-density was computed by normalizing coverage values by the unweighted CG density as described in [25]. (E) Comparison of hmTOP-seq coverage and 5hmC percentages estimated by bisulfite-based TAB-seq. Each dot represents the average hmTOP-seq value for specific TAB-seq percentage group (97% of all CG that overlap between hmTOP-seq and TAB-seq are used for analysis). (F) Correlation between hmTOP-seq coverage at 5hmCHs in technical replicates of 500-ng input mESC DNA libraries (OR = 347, p < 2.2 × 10⁻¹⁶; Fisher’s exact test). (G) Correlation of 5hmC signal between mESCs hmTOP-seq and nano-hmC-Seal data (average peak region size 615 bp). Within each nano-hmC-Seal peak region, total amount of signal from both methods was square-root transformed and correlated per each autosome. The data underlying this figure are included in S1 Data. 5hmC, 5-hydroxymethylcytosine; 5hmCG, hydroxymethylated CG site; 5hmCH, hydroxymethylated CH site, where H = A, C, or T; hmTOP-seq, 5hmC-specific tethered oligonucleotide–primed sequencing; mESC, mouse embryonic stem cell; OR, odds ratio; TAB-seq, Tet-assisted bisulfite sequencing.

