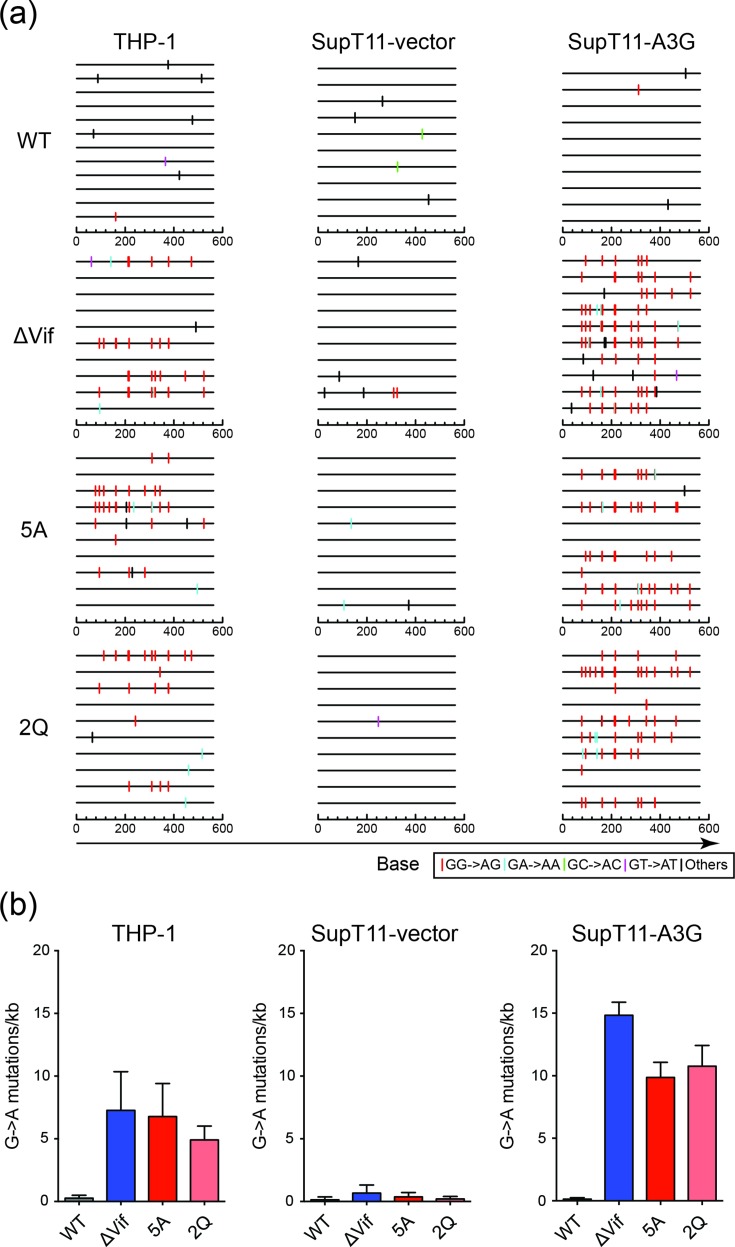
Fig. 5.
A3G is the primary source of G to A mutations in THP-1 cells. (a) Dinucleotide contexts of G to A mutations in the pol region of the indicated HIV-1IIIB viruses produced from the indicated cell lines. Each G to A mutation is shown as a vertical line (tick) on top of individual sequences illustrated to scale on a 564 bp amplicon with colours corresponding to dinucleotide context. (b) Average G to A mutation loads +/-sd for three independent experiments for the viruses and conditions described in (a).

