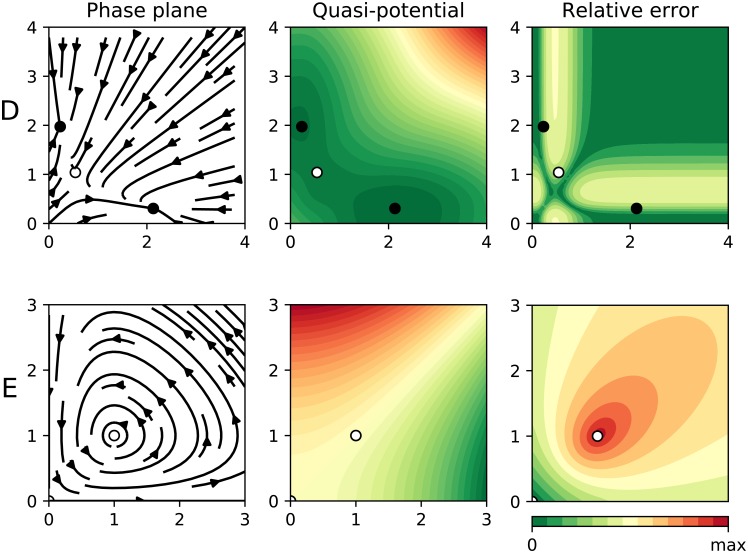
Fig 6. Results for two biological systems.
In all panels the dots represent equilibrium points (black for stable, otherwise white). The left panel shows the phase plane containing the actual “deterministic skeleton” of the system. The central panel shows the quasi-potential. The right panel shows the estimated error. In row D we applied our algorithm to the simple gene regulatory network described in Eq (22). In row E we apply our algorithm to a Lotka-Volterra system (Eq (23), with a = b = c = d = 1).

