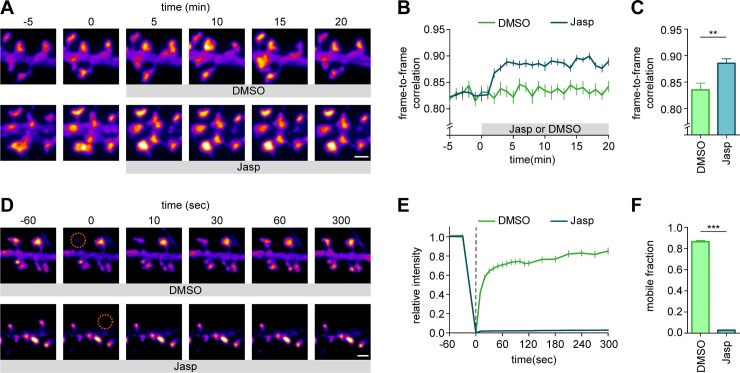
Fig 5. Live-cell imaging of intracellular endogenous protein dynamics.
(A) Representative images of dendrites transfected with GFP-β-actin knock-in imaged over time. DMSO or Jasp was added at time point 0. DIV 21. Scale bar, 1 μm. (B) Frame-to-frame correlation of pixel intensity over time for DMSO (green) or Jasp (blue) addition. (C) Quantification of mean frame-to-frame correlation averaged over the last five time points. (D) Representative images of FRAP experiment on dendrites transfected with GFP-β-actin knock-in vector. ROIs were bleached at time point 0 (orange circle). Recovery was followed over time. DIV 21. Scale bar, 1 μm. (E) FRAP analysis of GFP-β-actin knock-in neurons treated with DMSO (control) or Jasp. ROIs were bleached at time point 0 (dotted line). (F) Quantification of mobile fraction calculated from the last five time points of each bleached ROI averaged per neuron. Data are represented as means ± SEM. **P < 0.01, *** P < 0.001, Student t test. Underlying data can be found in S1 Data. DIV day in vitro; FRAP, fluorescence recovery after photobleaching; GFP, green fluorescent protein; Jasp, jasplakinolide; ORANGE, Open Resource for the Application of Neuronal Genome Editing; ROI, region of interest.

