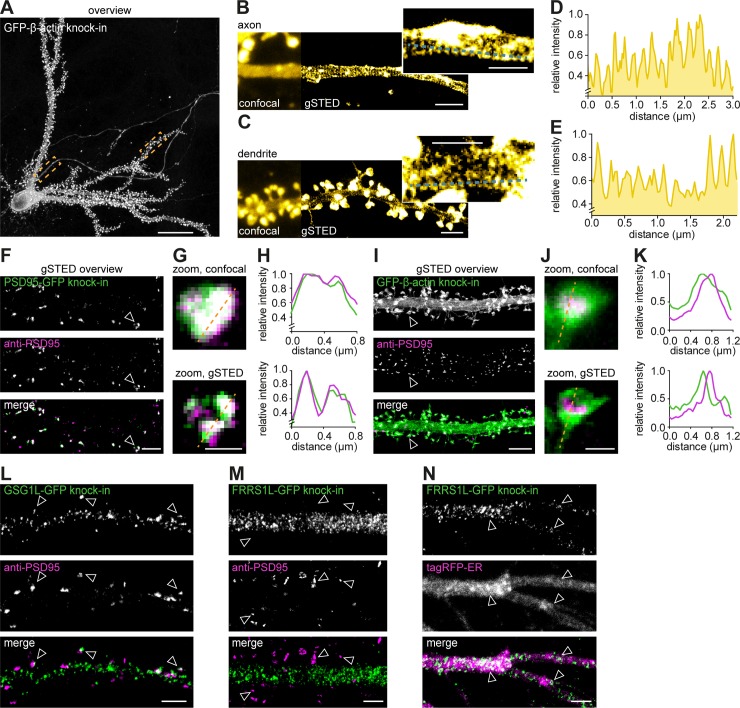
Fig 6. STED microscopy to resolve the subcellular distribution of endogenous proteins in individual neurons.
(A) Representative gSTED image of a GFP-β-actin knock-in neuron (DIV 21) enhanced with anti-GFP (ATTO647N). Scale bar, 20 μm. (B and C) Zooms of axon (B) and dendrite (C) as indicated with boxes in (A) comparing confocal and gSTED imaging. Scale bar, 2 μm; insert scale is 1 μm. (D and E) Line scans from zooms in (B) and (C), respectively. (F) Representative gSTED images of dendrites positive for PSD95-GFP knock-in stained with anti-GFP (green, ATTO647N) and anti-PSD95 staining (magenta, Alexa594). DIV 21. Scale bar, 2 μm. (G) Zooms from (F) of individual synapses resolved with confocal and gSTED. Scale bar, 500 nm. (H) Line scans of confocal and gSTED images shown in (G). (I) Representative gSTED images of dendrites positive for GFP-β-actin knock-in stained with anti-GFP (green, ATTO647N) and anti-PSD95 (magenta, Alexa594). DIV 21. Scale bar, 2 μm. (J) Zooms from (I) of individual spines resolved with confocal and gSTED. Scale bar, 500 nm. (K) Line scans of confocal and gSTED images shown in (J). (L and M) Representative gSTED images of dendrites positive for GSG1L-GFP (L) or FRRS1L-GFP knock-in (M) stained with anti-GFP (green, Alexa488) and anti-PSD95 (magenta, ATTO647N). DIV 21. Scale bar, 5 μm. (N) Representative images of dendrites positive for FRRS1L-GFP knock-in enhanced with anti-GFP (gSTED, green) and coexpressed with tagRFP-ER (confocal, magenta). DIV 21. Scale bar, 2 μm. DIV, day in vitro; ER, endoplasmic reticulum; FRRS1L, Ferric-chelate reductase 1-like protein; GFP, green fluorescent protein; GSG1L, Germ cell-specific gene 1-like protein; gSTED, gated STED; PSD95, postsynaptic protein 95; RFP, red fluorescent protein; STED, stimulated-emission depletion.

