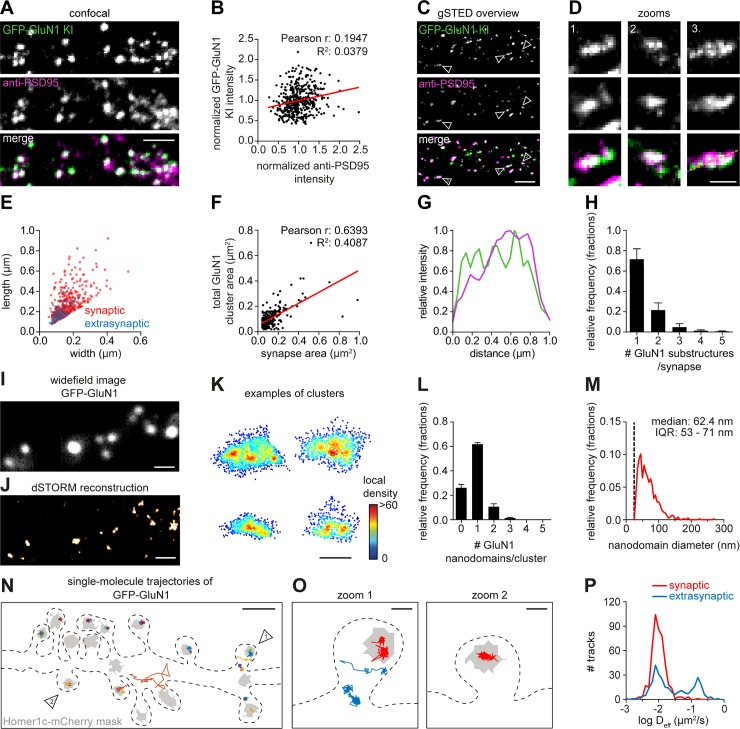
Fig 7. NMDA receptors concentrate in subsynaptic nanodomains and are highly immobilized in synapses.
(A) Representative images of a dendrite positive for GFP-GluN1 KI (green) stained for PSD95 (magenta, Alexa647). Scale bar, 2 μm. (B) Correlation between GFP-GluN1 KI and anti-PSD95 staining intensity within individual GFP-GluN1 puncta. (C) Representative gSTED images of dendrites positive for GFP-GluN1 KI enhanced with anti-GFP (green, ATTO647N) and anti-PSD95 (magenta, Alexa594). DIV 21. Scale bar, 2 μm. (D) Zooms of individual synapses indicated in (C). Scale bar, 500 nm. (E) FWHM analysis of GFP-GluN1 structures comparing width and length of individual synaptic (red) and extrasynaptic (blue) GluN1 clusters. (F) Correlation between GFP-GluN1 cluster area and synapse area (based on anti-PSD95 staining) for individual synapses. (G) Line scan of synapse zoom 3 in (D). (H) Quantification of the number of GFP-GluN1 substructures per synapse. (I) Representative image of dendrite positive for GFP-GluN1 KI stained with anti-GFP (Alexa647). DIV 21. Scale bar, 1 μm. (J) Single-molecule dSTORM reconstruction of example shown in (I). Scale bar, 1 μm. (K) Examples of individual GFP-GluN1 clusters with single localizations plotted and color-coded based on the local density. Scale bar, 200 nm. (L) Quantification of number of GFP-GluN1 nanodomains per cluster. (M) Frequency distribution of GFP-GluN1 nanodomain size. Dotted line indicates nanodomain size cutoff. Bin size: 5 nm. (N) Representative example of GFP-GluN1 (anti-GFP nanobody conjugated to ATTO647N) single-molecule trajectories in a dendrite plotted with a random color and on top of a synapse mask (gray) based on Homer1c-mCherry widefield image. Dotted line indicates cell outline. DIV 21. Scale bar, 1 μm. (O) Zooms of individual spines indicated in (N) with example trajectories of synaptic (red) or extrasynaptic (blue) receptors. Scale bar, 200 nm. (P) Frequency distribution showing the diffusion coefficient of synaptic and extrasynaptic tracks. Data in bar plots are presented as means ± SEM. Underlying data can be found in S1 Data. DIV, day in vitro; dSTORM, direct stochastic optical reconstruction microscopy; FWHM, Full Width at Half Maximum; GFP, green fluorescent protein; GluN, glutamate receptor NMDA; gSTED, gated stimulated-emission depletion; KI, knock-in; NMDA, N-methyl-D-aspartate; PSD95, postsynaptic protein 95.

