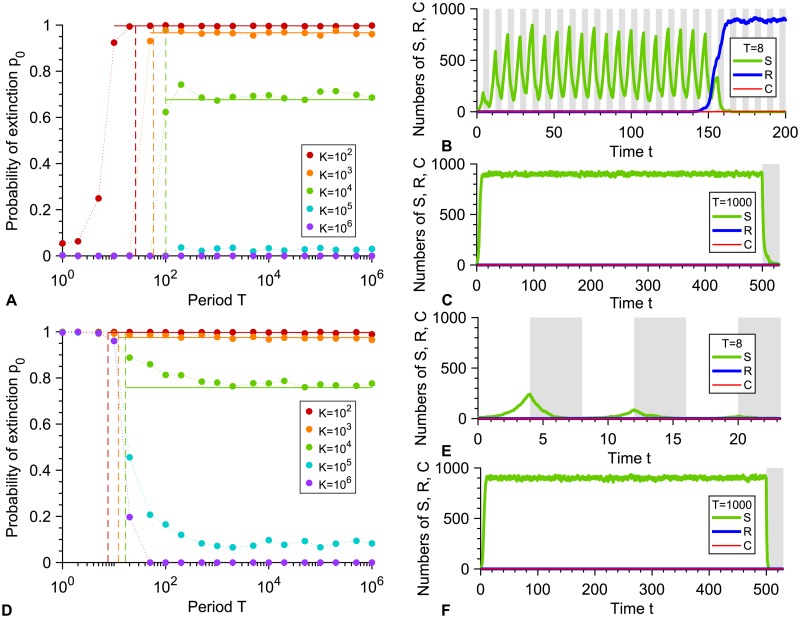
Fig 2. Periodic presence of a biocidal antimicrobial above the MIC.
A: Probability p0 that the microbial population goes extinct before resistance gets established versus alternation period T, for various carrying capacities K. Markers: simulation results, with probabilities estimated over 102 − 103 realizations. Horizontal solid lines: analytical predictions from Eq 4. Dashed lines: T/2 = τS. B and C: Numbers of sensitive (S), resistant (R) and compensated (C) microorganisms versus time in example simulation runs for K = 1000, with T = 8 and T = 1000 respectively. In B, resistance takes over, while in C, extinction occurs shortly after antimicrobial is first added. Phases without (resp. with) antimicrobial are shaded in white (resp. gray). Parameter values in A, B and C: fS = 1, fR = 0.9, fC = 1, gS = 0.1 without antimicrobial, with antimicrobial, gR = gC = 0.1, μ1 = 10−5 and μ2 = 10−3. All simulations start with 10 S microorganisms. D, E and F: same as A, B and C, but with . All other parameters are the same.

