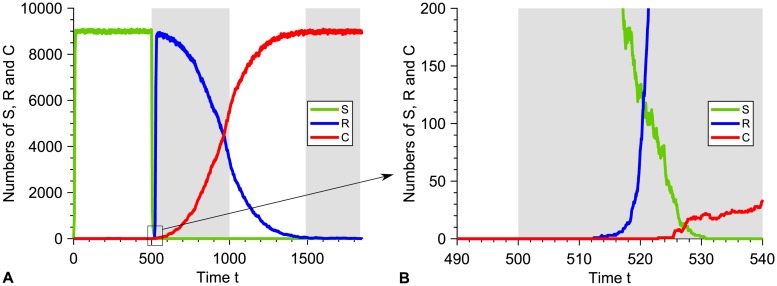
Fig 3. Resistance emergence in the presence of a biocidal antimicrobial above the MIC.
A: Numbers of sensitive (S), resistant (R) and compensated (C) microorganisms versus time in an example simulation run for K = 104, with T = 1000. Here resistance takes over. Phases without (resp. with) antimicrobial are shaded in white (resp. gray). B: Zoom showing the emergence of resistance in this realization: an R mutant appears after antimicrobial is added (gray). At this time, the S population is decreasing due to the antimicrobial-induced high death rate, but the surviving S microorganisms are still able to divide. Parameter values and initial conditions are the same as in Fig 2A, 2B and 2C.

