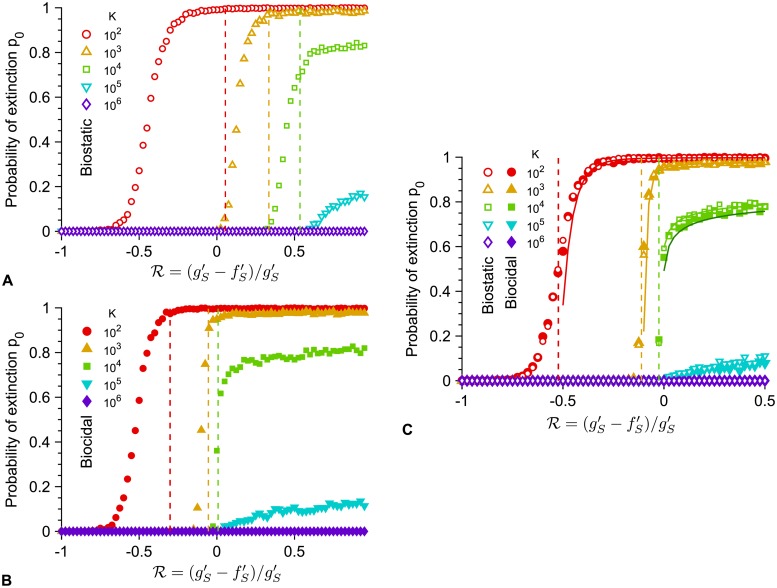
Fig 6. Dependence of the extinction transition on population size and antimicrobial mode of action.
Extinction probability p0 versus the ratio with biostatic or biocidal antimicrobial, for different carrying capacities K, either in the small-period regime, with T = 102.5 (A and B) or in the large-period regime, with T = 105 (C). Markers: simulation results, calculated over 103 realizations. Vertical dashed lines: predicted extinction thresholds, i.e. values of such that T/2 = τS (A and B) or (C). Solid lines (C): Analytical estimates of p0 from Eq 1 (biostatic) or Eq 4 (biocidal). For K = 102 and 103, the analytical predictions in the biostatic and biocidal case are confounded, while for K = 104 we used two shades of green to show the slight difference (light: biostatic, dark: biocidal). Parameter values: μ1 = 10−5, μ2 = 10−3, fS = 1, fR = 0.9, fC = 1, gS = gR = gC = 0.1, and (biostatic) or (biocidal). All simulations start with 10 S microorganisms.

