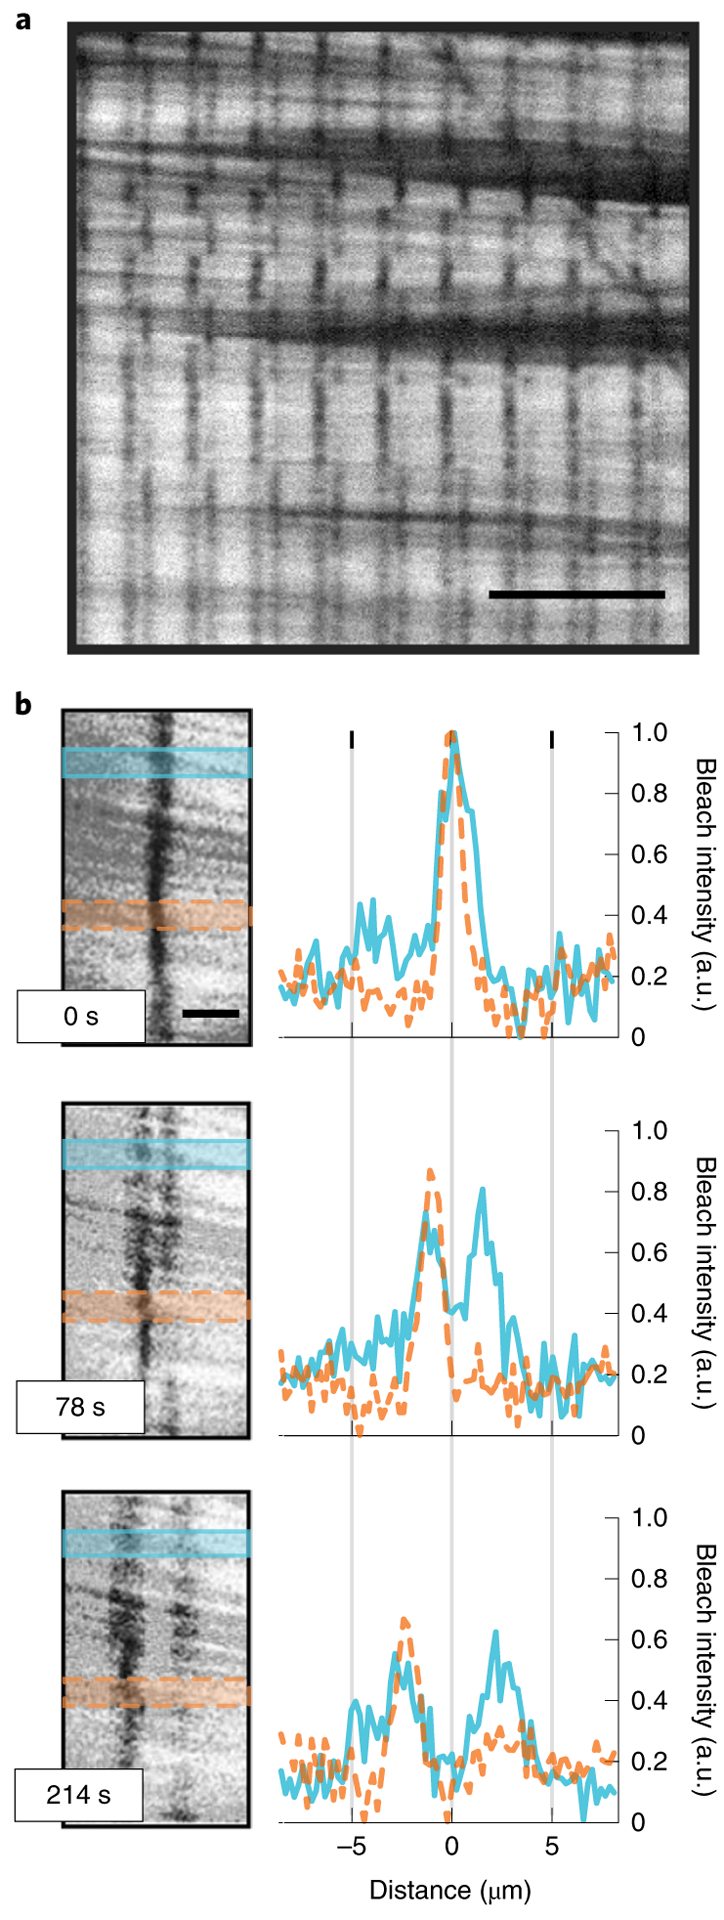
Fig. 1 |. Bleaching of aligned active gels reveals microtubule sliding speed.

a, Aligned active gel after multi-line photobleaching. Scale bar, 20 μm. b, Left: higher magnification images of a bleached line taken at three different times. The bleached line with spatially varying polarity splits into two parallel lines as the microtubules slide apart. Solid blue and dashed orange shaded areas highlight regions of low and high polarity respectively. Right: intensity profiles of the high polarity (dashed orange, Pbleach = 0.63 ±0.12 standard error) and low polarity (solid blue, Pbleach = 0.08 ± 0.17 standard error) regions. Despite the difference in polarity, the peaks move apart at nearly identical speeds. Scale bar, 5 μm. XCTK2 concentration is 0.4 μM.
