Figure 1.

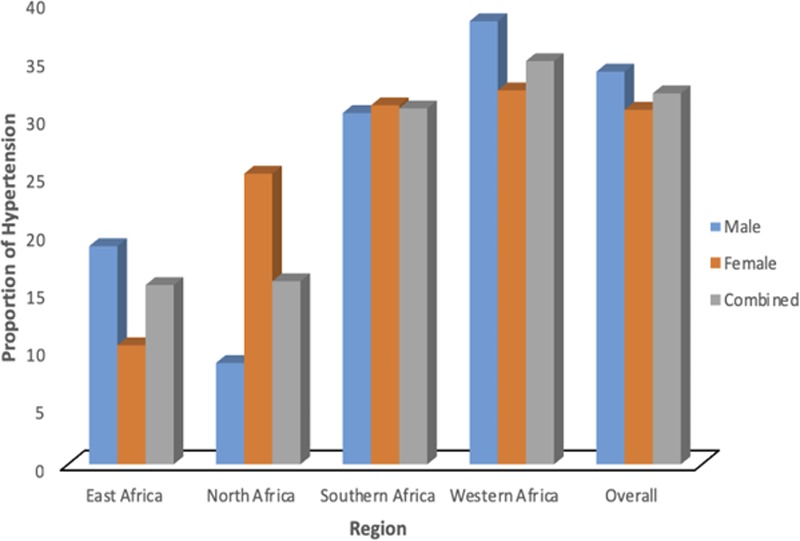
Regional differences in the age-adjusted proportion of hypertension using only the population controls dataset (PC) (for male, female, and the combined samples).

Regional differences in the age-adjusted proportion of hypertension using only the population controls dataset (PC) (for male, female, and the combined samples).