
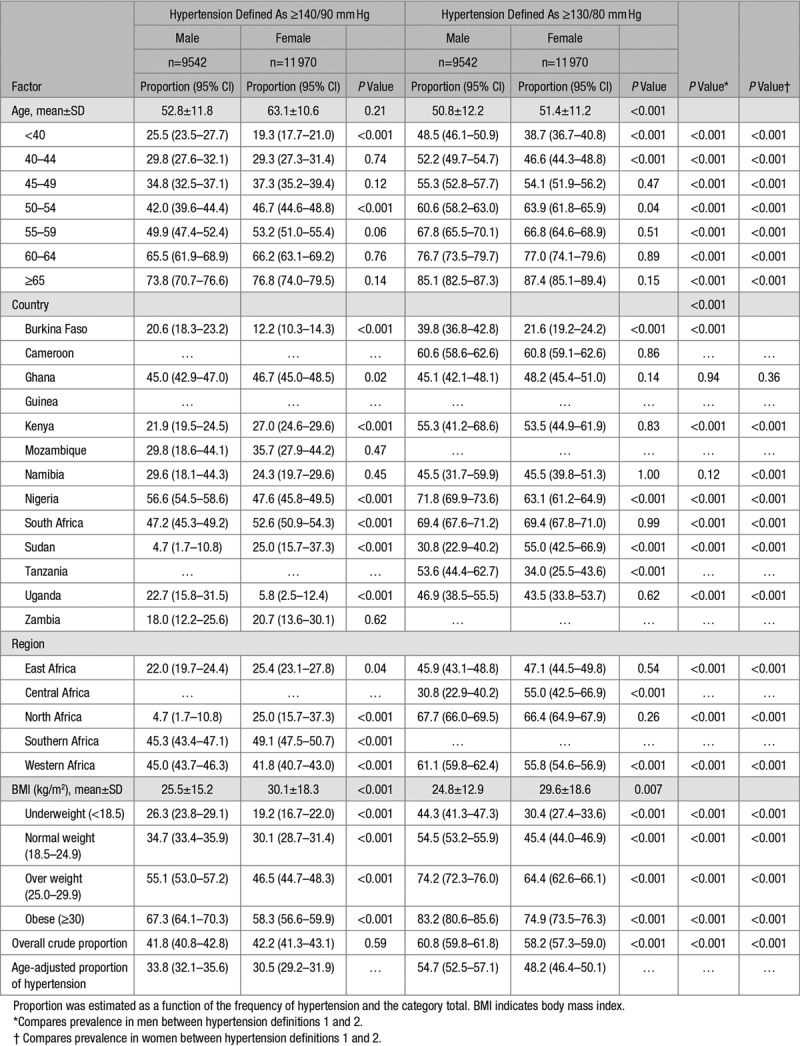
Table 3.
Proportion of Hypertension Among Population Controls (PC) Stratified by Sex Per Age Group, Country, Geographic Region, BMI, and Obesity
Official websites use .gov
A
.gov website belongs to an official
government organization in the United States.
Secure .gov websites use HTTPS
A lock (
) or https:// means you've safely
connected to the .gov website. Share sensitive
information only on official, secure websites.
Proportion of Hypertension Among Population Controls (PC) Stratified by Sex Per Age Group, Country, Geographic Region, BMI, and Obesity