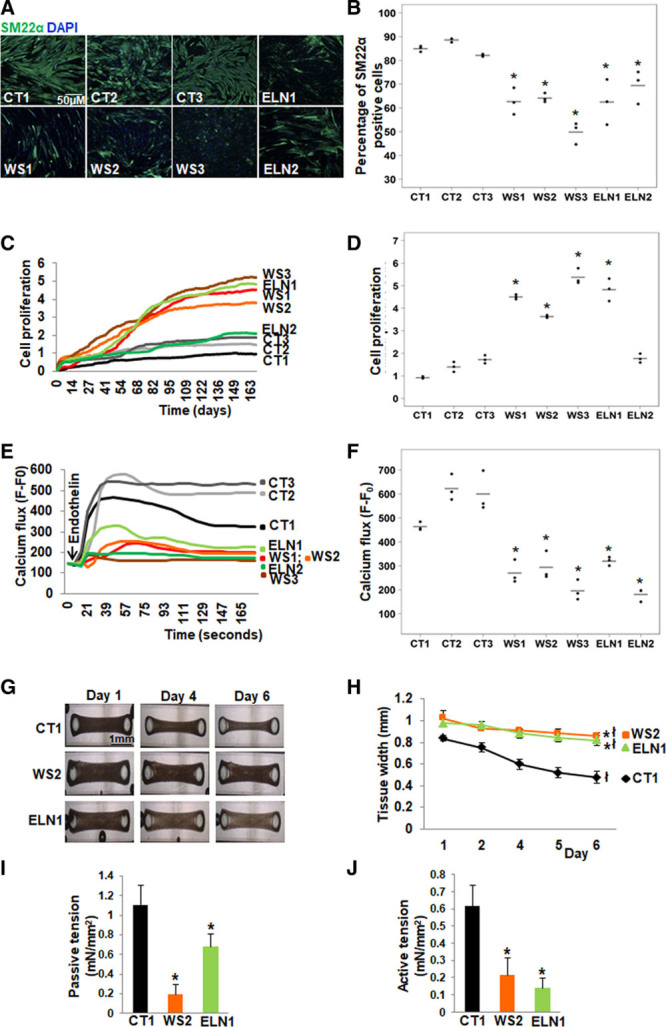
Figure 2.

Abnormal smooth muscle cell (SMC) differentiation, proliferation and function in elastin insufficiency (EI) induced pluripotent stem cells (iPSC)-SMCs. A, SM22α (smooth muscle 22α) staining (representative images) and (B) quantification by high content imaging revealed the percentage of SM22α positive cells was lower in all patient with Williams syndrome (WS) and in ELN (elastin) patient SMCs compared with control SMCs. C, SMC proliferation measured by cell impedance (representative graph of cell index), and (D) quantification revealed increased proliferation in all 3 WS SMCs and in ELN1 patient SMCs compared to control SMCs. ELN2 patient SMC proliferation was not different from control SMCs. E, Calcium flux in response to endothelin (representative graph from 50 cells from an individual well) and (F) quantification from all replicates of maximum peak of mean fluorescence intensity after background correction (F–F0) showed lower calcium flux in response to endothelin in all patient SMCs compared with control SMCs (n=3 independent biological replicates and 3 technical replicates each for differentiation, proliferation, and calcium assays). G, Biowires generated from iPSC-SMCs from one control (CT1), one WS (WS2), and one ELN mutant patient (ELN1) showed failure of compaction of patient SMCs compared to control SMCs on day 6. H, Graph shows the change in the diameter of SMC-seeded biowires from day 1 to 6. All biowires showed some compaction by day 6, and the biowire diameter on day 6 remained significantly larger in WS2 and ELN1 patients compared to CT1 control. I, Passive tension at baseline was lower in patient SMC biowires compared with control. J, Active tension following treatment with endothelin was lower in patient SMC biowires compared to control (n=3 independent experiments). A–J, Supporting data are included in Table IIIA in the Data Supplement. *P<0.05, patient vs control, łP<0.05, day 6 vs 1.
