
Figure 3.
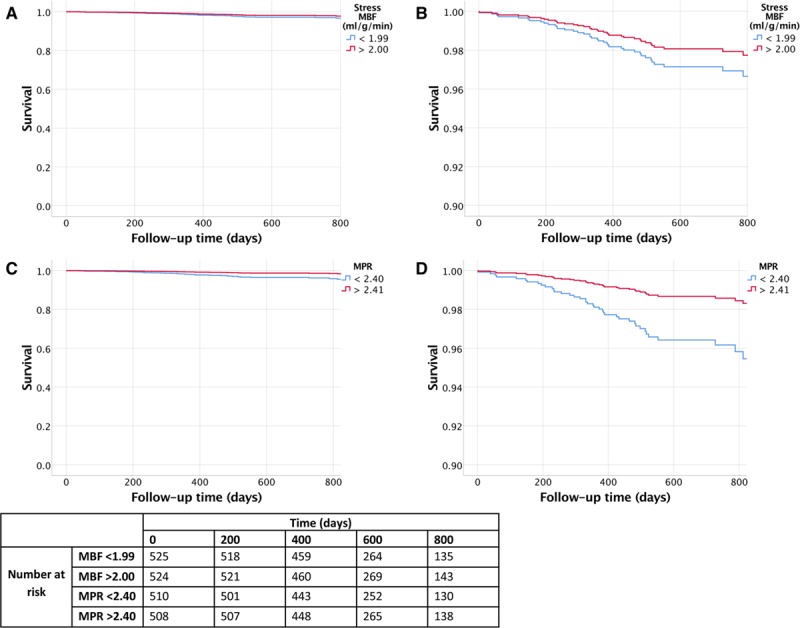
Kaplan-Meier survival estimate curves for stress myocardial blood flow (MBF) and myocardial perfusion reserve (MPR). Stress MBF (A and B) and MPR (C and D). The red lines demonstrate the survival curves for the highest 50th percentile, and the blue lines demonstrate the lowest 50th percentile of patients. B and D, Magnified to highlight the separation of the curves. Rates of death are higher with impaired perfusion. Compared with patients in the highest 50th percentile, the patients in the lowest 50th percentile of MBF and MPR had higher rates of death (P=0.032 and P=0.01, respectively).