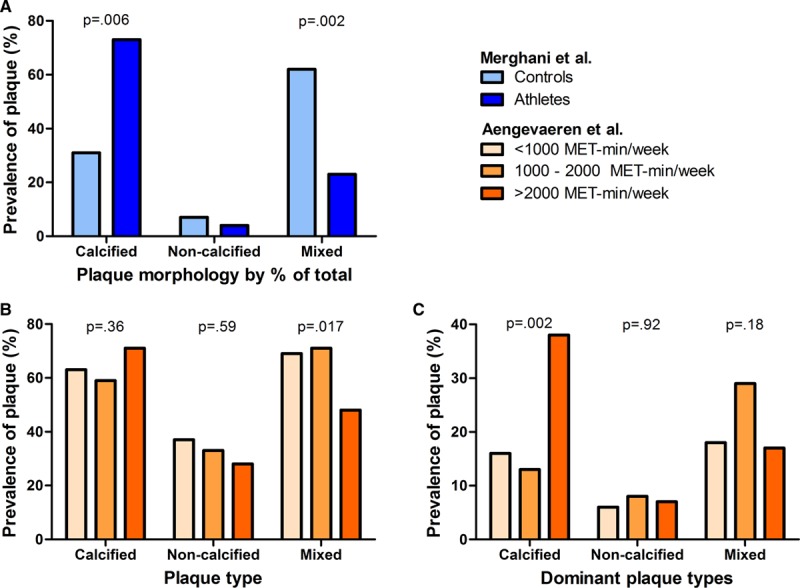
Figure 3.

Coronary plaque morphology in athletes. Panel A illustrates the percentages of different coronary plaque morphologies of the 99 plaques in athletes and 26 plaques in the control subjects (total equals 100%).5 Panel B illustrates the percentages of different coronary plaque morphologies in athletes with plaques, presented for lifelong exercise volume groups,4 whereas Panel C illustrates the percentage of athletes with plaques who had only calcified, only noncalcified or only mixed plaque morphology.4 Adapted and reprinted with permission from Merghani et al5 (A) and Aengevaeren et al4 (B and C). MET indicates metabolic equivalent of task.
