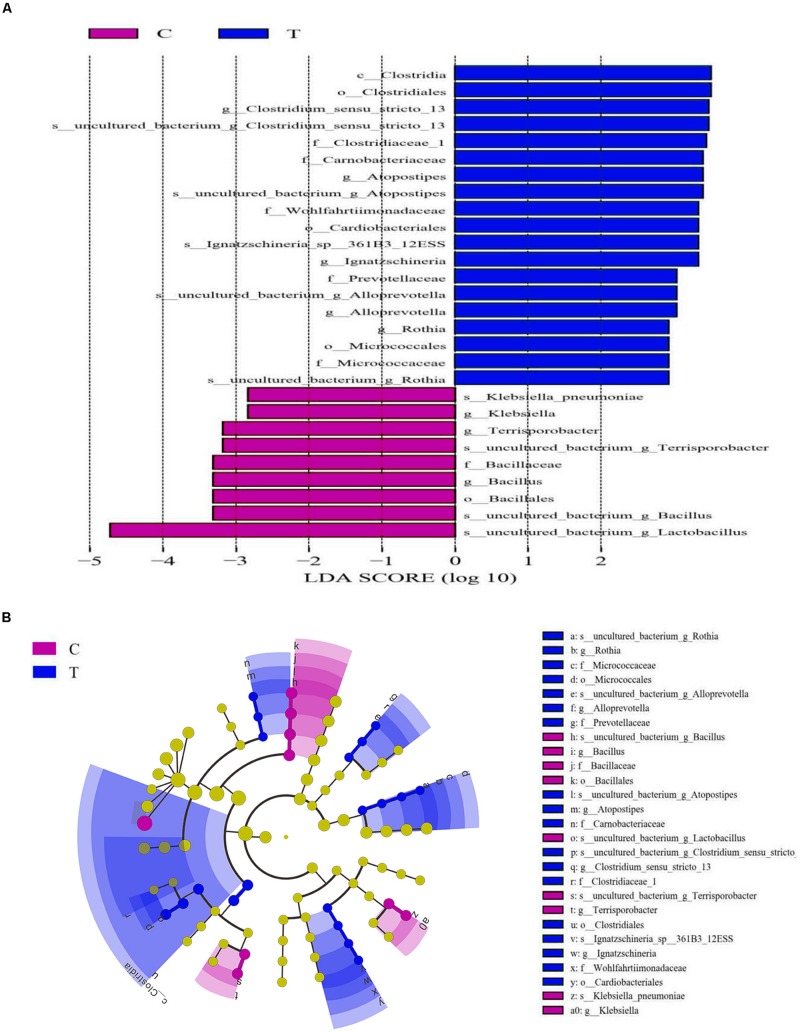
FIGURE 3.
Linear discriminant analysis (LDA) combined effect size measurements (LEfSe) analysis of ileal microbiota of laying hens. (A) Species with significant differences (P < 0.05) that have an LDA score greater than the estimated value (2.0). (B) The cladogram diagram shows the microbial species with significant differences between groups. The species classification at the levels of phylum, class, order, family, and genus exhibited from the inside to the outside. C, control group; T, Clostridium butyricum treatment group.

