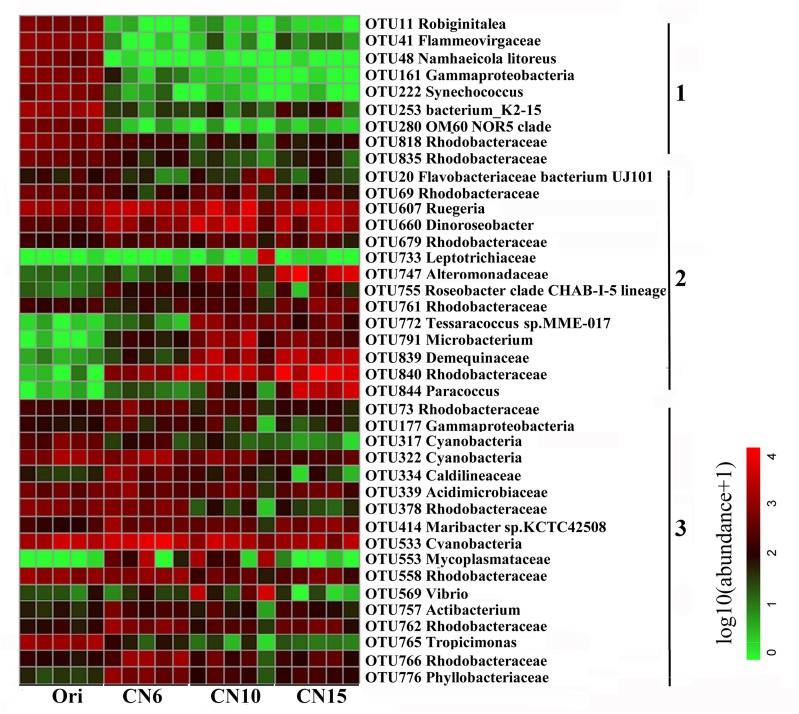
FIGURE 3.
Heatmap summarizing the relative abundance of the top 40 abundant OTUs in the intestine of L. vannamei. Microbial abundance was scaled with log transformation in the heatmap. The OTUs were organized by their phylogenetic positions; the taxa of OTUs are shown on the right. 1, cluster 1 indicating that the abundance was the highest in the group Ori (Day 0); 2, cluster 2 indicating that the abundance was increased in the group CN10, CN15 or both of them, compared to that in the group CN6; 3, cluster 3 indicating that the abundance was decreased in the group CN10, CN15 or both of them, compared to that in the group CN6.

