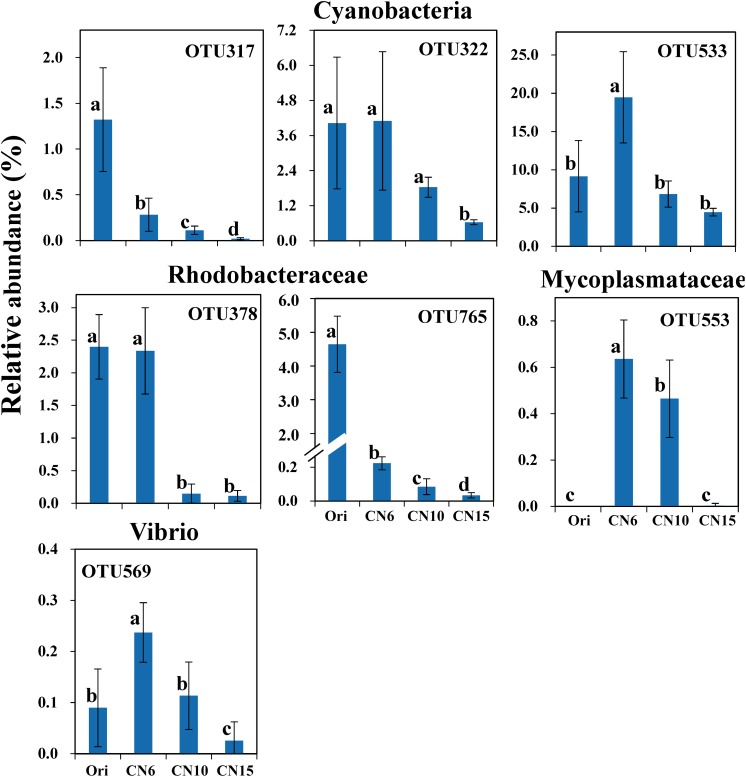
FIGURE 5.
The significantly reduced OTUs in average relative abundance at the CN10 and CN15 compared to the CN6. The detailed information of indicator taxa (OTUs) was showed in Supplementary Table S1. Values represent mean ± standard deviation (n = 5). Bars with different letters indicate significant differences at P < 0.05 according to Duncan’s multiple range tests.

