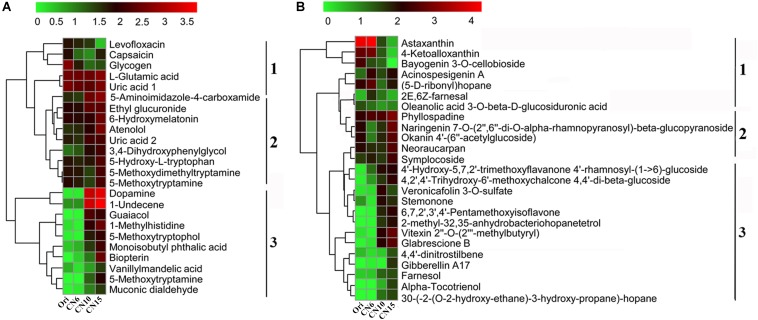
FIGURE 7.
Heatmap was applied to visualize the differences in the composition of metabolites among different groups. (A) Metabolites mainly related to benzene, phenols and indoles; (B) Metabolites mainly related to polyketides and prenol lipids. Microbial metabolite concentration was scaled with log transformation in the heatmap. 1, cluster 1 represents a significant down-regulated at CN10 and CN15, compared to those at CN6; 2, cluster 2 represents a slightly up-regulated at CN10 and a significantly increased at CN15, compared to those at CN6; 3, cluster 3 represents those with low concentrations in the groups Ori (Day 0) and CN6, but they have high concentrations in the groups CN10 or CN15.

