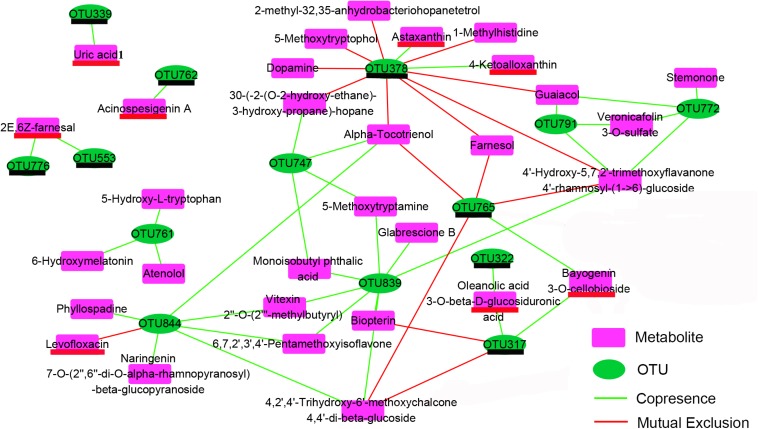
FIGURE 8.
Co-occurrence network depend on the Pearson correlation characterizes the significant correlations between differential OTUs (Figure 3) and differential metabolites (Figure 7) in shrimp intestines. The OTUs underlined in black color belong to the Cluster 3 in Figure 3; the metabolites underlined in red color belong to the Cluster 1 in the Figure 7.

