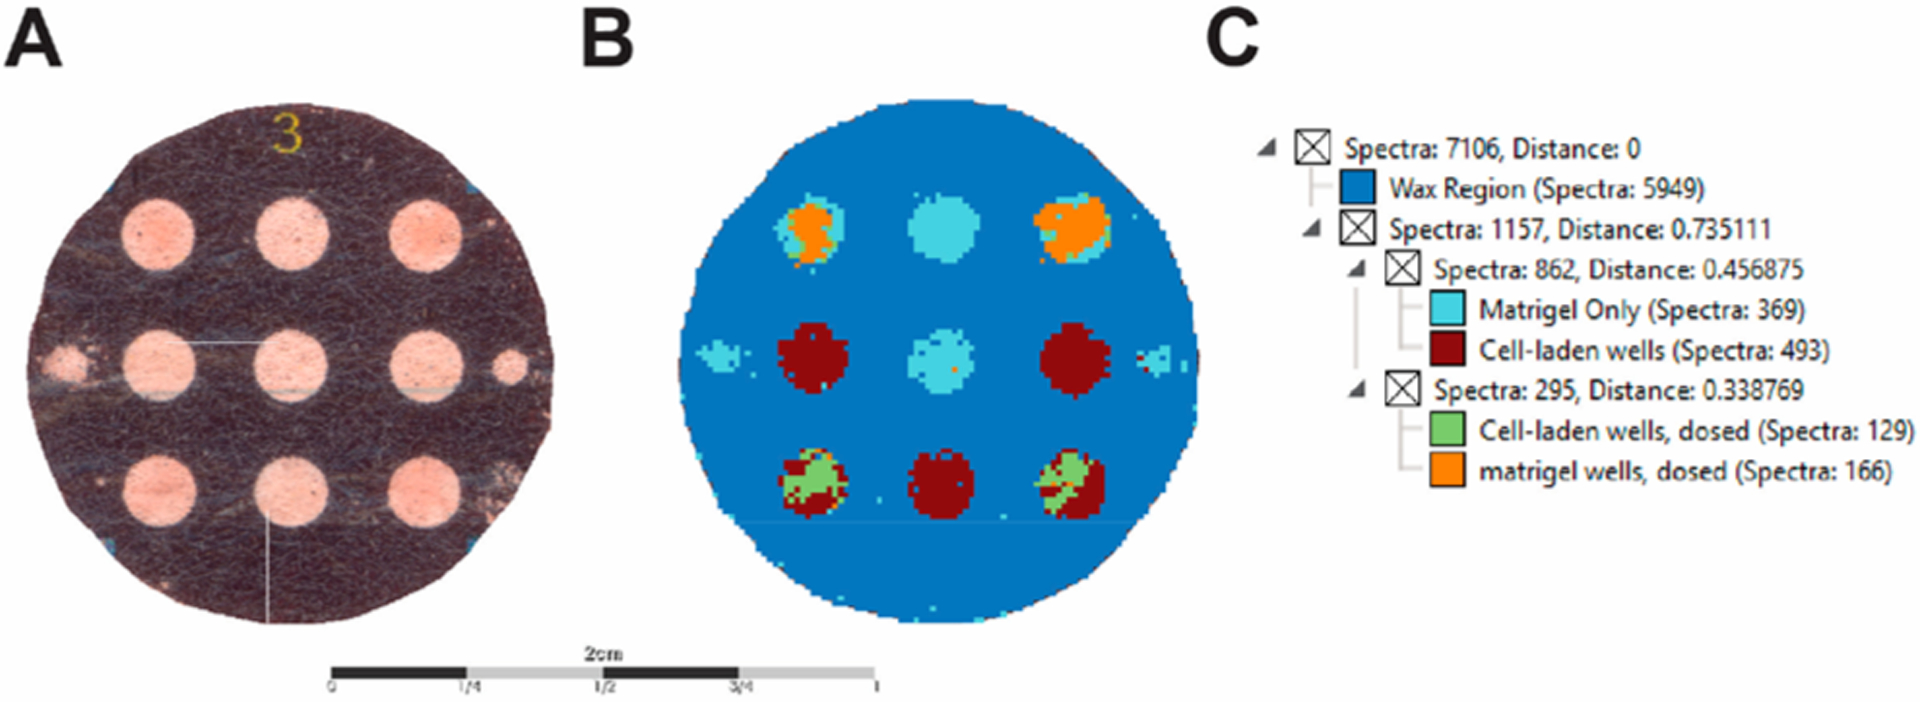
Figure 2.

Segmentation map and cluster dendrogram of PBCs. (A) Optical image of the PBC scaffold. (B) Segmentation map of MSI data using the bisecting k-means algorithm. (C) Dendrogram of the correlation distance of subclusters representing distinct regions of the PBC. Note that the algorithm discriminated the dosed wells that contained cells and the wells that only contained Matrigel. Scale bar is 2 cm.
