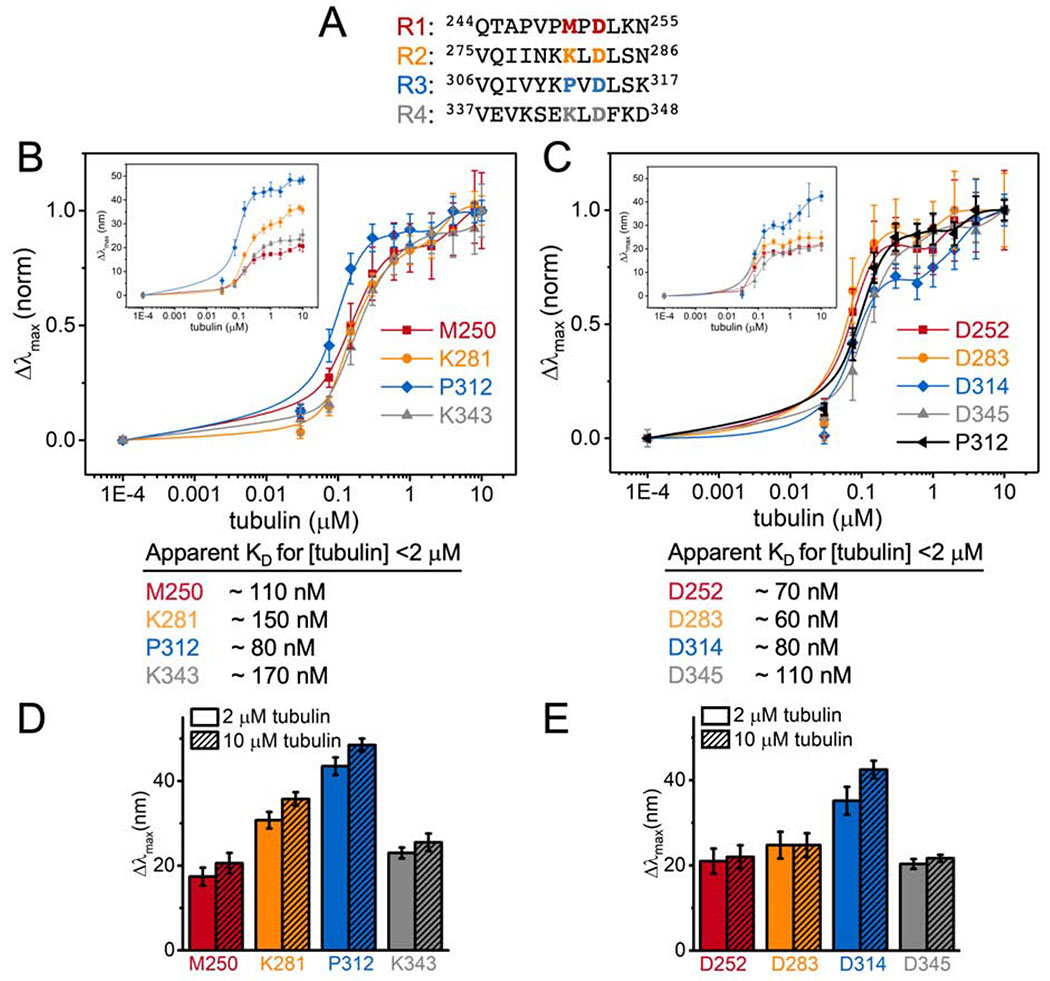
Figure 3. Hierarchy in tubulin occupancies in MTBR.
(A) Equivalent residues tested highlighted in red, orange, blue and grey for R1 – R4 respectively. Normalized Δλmax of tauacrylodan at (B) K281 and (C) D283-equivalent positions upon binding to tubulin. Tau only measurements were plotted at 1E-4 μM tubulin for visualization. Data points are mean ± SD, n≥3. Insets are the raw Δλmax. Approximate KDs from binding to [tubulin] <2 μM are reported below. (D and E) Bar graph for Δλmax with 2 or 10 μM tubulin for comparison.

